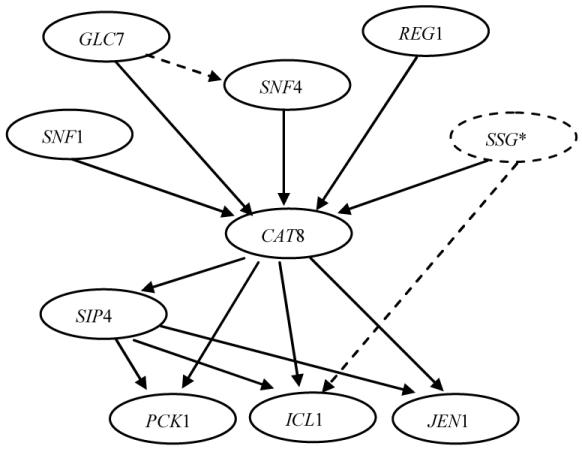
Figure 4.

SNF1 simulation pathway model. Dotted lines represent the causal relationships that are biologically plausible, but need further investigation. SSG* represents a group of genes, i.e., SIP1, SIP2, and GAL83. SSG was modeled in the simulator but was hidden to the participants in the control study; i.e., the expression level of SSG was not provided to the participants
