
Figure 2.
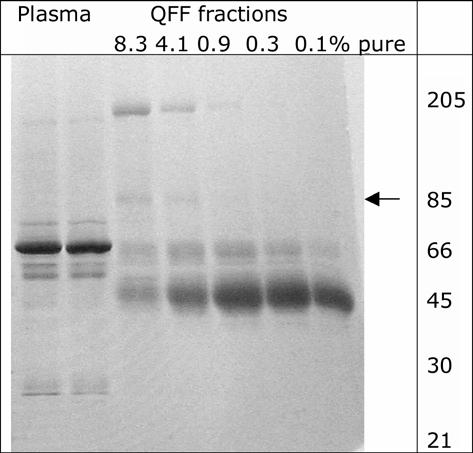
SDS gel stained with Coomassie blue Plasma before and after dialysis and fractions from QFF were applied at 5 micrograms protein per lane. The BChE band at 85 kDa is indicated by an arrow. BChE is a faint band in the 8.3 and 4.1% pure fractions. The 66 kDa albumin band is intense in plasma but not in the QFF fractions, indicating that most of the albumin has been removed by ion exchange at pH 4.0.