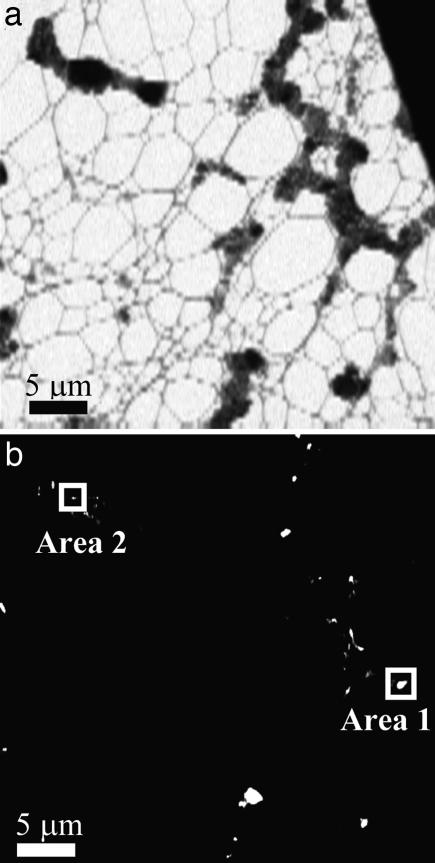
Fig. 1.
STXM images of Lake Van microbialites. (a) Image of microbialites at 288.2 eV. Image is 4 μm × 40 μm. (b) Map of peptide-rich areas absorbing at 288.2 eV showing a number of bright spots of various morphologies. Area 1 and area 2 correspond to bright spots that were further analyzed in Figs. 2 and 4, respectively.

