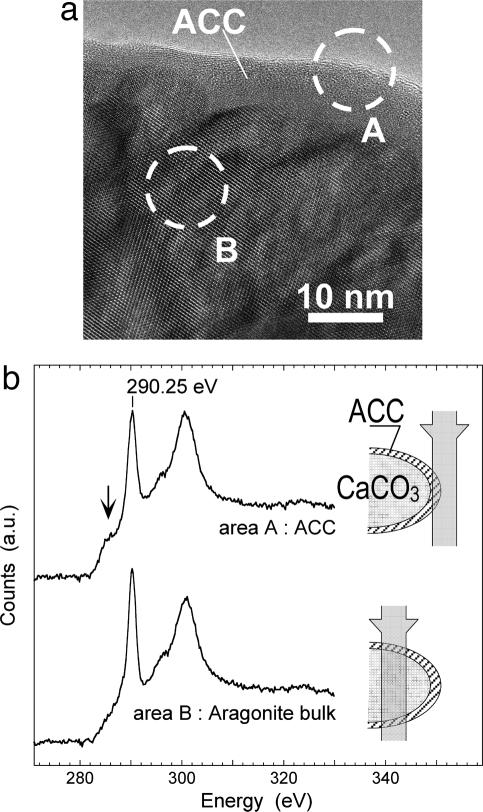
Fig. 5.
TEM observation of Lake Van aragonite nanocrystals. (a) HRTEM image of an aragonite crystal along the [1–11] zone axis. The presence of lattice fringes in the interior of the aragonite indicates that this region is crystalline, and their absence in the edge region indicates an amorphous outer layer. (b) EELS spectra of the crystallized inner part (area B) versus the amorphous outer layer (area A). (Insets) Schematic views of the electron beam path through an aragonite nanoglobule for areas A and B. Area A contains only the ACC layer, whereas area B contains mostly aragonite and a small fraction of ACC. The arrow shows a peak at 287 eV observed in spectrum of the ACC layer, which is more poorly resolved in the spectrum of bulk aragonite.

