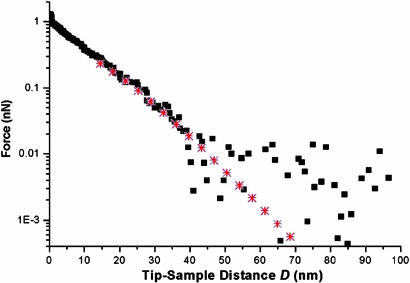
Fig. 4.
Semilogarithmic plot of the steric repulsion (from Fig. 3, black squares) and corresponding AdG fit (red stars). From the fit we obtain s = 23.6 nm and L = 39.0 nm. The data collected beyond D ∼ 40 nm is scattered because it is less than the minimum detectable force, which is given by the thermal noise of the cantilever: Fmin = (kBT·kc)1/2 ≈ 0.01 nN.

