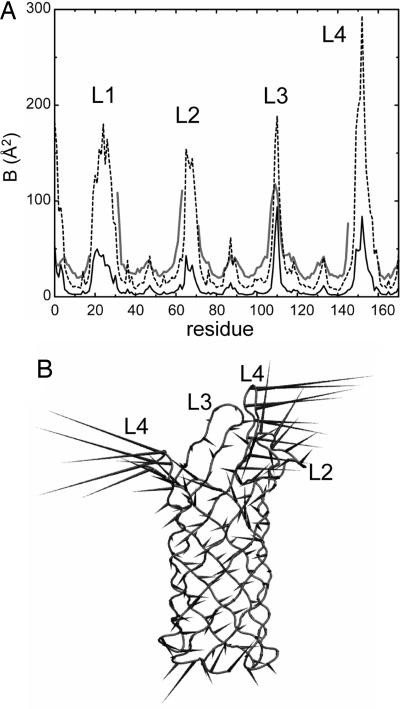
Fig. 2.
Average fluctuations and correlated motions. (A) Time-averaged (excluding the first 5 ns) simulation Cα B factors compared with experimental (i.e., x-ray) B factors. The x-ray B factors are shown as a gray line; the simulation B factors obtained by averaging the four simulation B-factor curves for the individual chains are shown as a broken line; and the simulation B factors derived from a trajectory composed of the average structure of all four OmpA chains at each point in time are shown as a solid black line. (B) Schematic “porcupine plot” diagram of the first principal component of the simulated motion of OmpA chain C (shown in Cα trace format). The cones represent fluctuations, with their orientation indicating the direction of motion of the Cα atom to which they are attached and their length indicating the amplitude of this motion. The figure was made by using dynamite (21).

