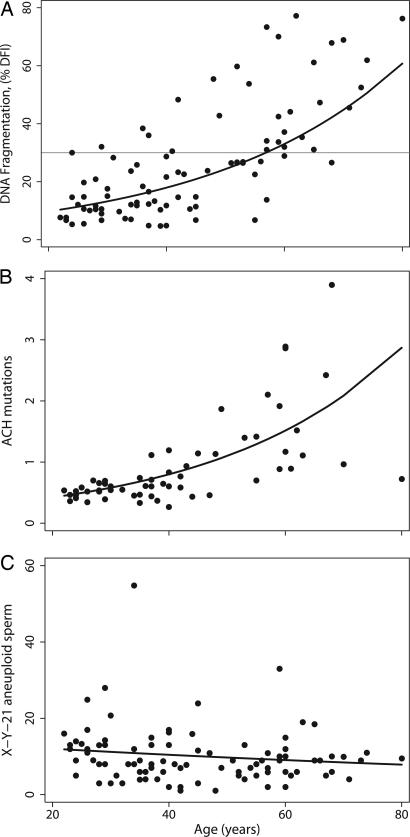
Fig. 1.
Relationship between male age and selected genomic defects in sperm. Data for each man are plotted with the regression line for age (Table 1; see Fig. 4 for other endpoints). (A) %DFI vs. age. The regression was adjusted for abstinence. The horizontal line is the threshold value (30%) associated with decreased pregnancy rates. (B) ACH mutations (1138G>A) per 10,000 genomes vs. age. The unadjusted negative binomial regression line is shown. Adjusting the model for the history of working with radioisotopes did not significantly change the regression results. (C) X-Y-21 aneuploid sperm per 10,000 sperm vs. age. The unadjusted negative binomial regression line is shown. Adjusting for covariates did not change the relationship (Table 4).

