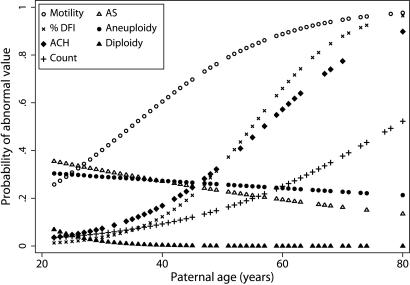
Fig. 3.
Probabilities of producing an abnormal semen specimen with increasing age. Maximum-likelihood logit curves were generated to estimate the probabilities at each year of age of producing a semen sample that exceeded the following abnormality values: (○) Motile sperm <50%; ×%DFI > 30%; +total count ≤ 40 × 106; as well as doublings in the frequencies of abnormal sperm compared with the 20- to 29-year-old group for: (♦ ACH mutations (1138G>A in FGFR3); (▵) AS mutations (755C>G + 758C>G in FGFR2); (●) aneuploid sperm (hyper- and hypohaploid); and (▴) diploid sperm (hyper- and hypohaploid). Sperm motility and concentration curves are adapted from Eskenazi et al. (5). The %DFI model was adjusted for abstinence, and the ACH model was adjusted for radiation exposure.

