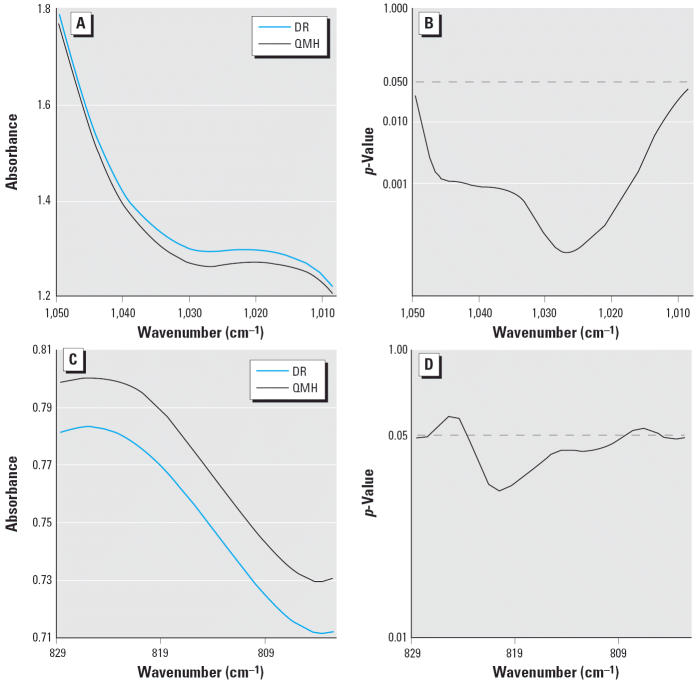
Figure 2.
(A) Comparison of mean DNA spectra of liver from the DR and QMH fish between 1,050 and 1,009 cm−1. (B) p-Values from a t-test showing significant differences between these mean spectra. (C) Comparison of mean DNA spectra of liver from the DR and QMH fish between 829 and 803 cm−1. (D) p-Values from a t-test showing significant differences between these mean spectra.

