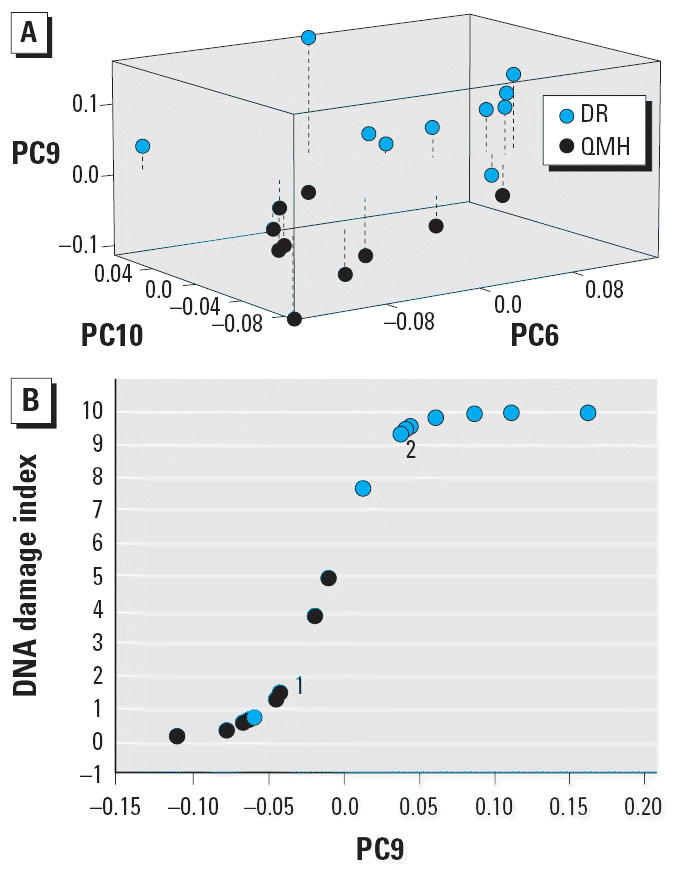
Figure 3.

(A) Three-dimensional separation of PC scores from the DNA spectra of liver from the DR and QMH fish. Dashed lines show the distance from the PC9 baseline level of 0. (B) DNA damage index derived by logistic regression analysis using PC9 scores for liver DNA from the DR and QMH fish. Overlapping points: 1, Two QMH samples; 2, two DR samples.
