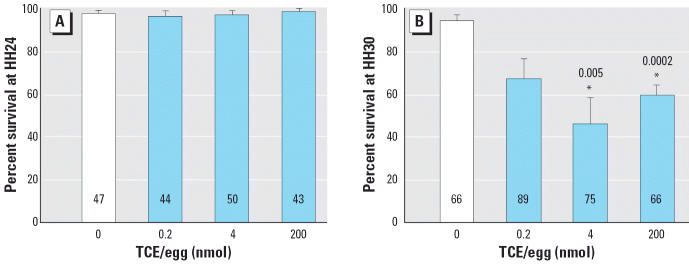
Figure 2.
Effects of TCE on chick embryo survival at (A) HH24 and (B) HH30. Values shown are mean percent survival (± SE) for embryos exposed to TCE during cardiac cushion formation. Each panel represents the mean of five experiments; numbers within bars indicate the total number of embryos.
*Significantly different from 0 nmol treatment (p < 0.01); p-values are given above bars.

