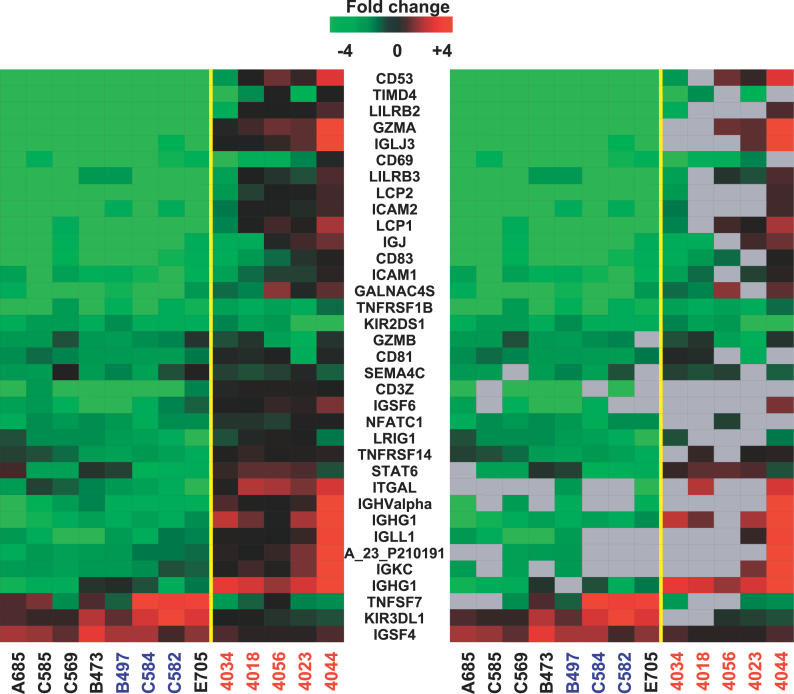
Figure 6. Expression of Markers Associated with Immune Cells in HCV-Infected Mice and Patients.
Expression of genes that were at least 2-fold regulated with p ≤ 0.05 in at least three of 13 experiments comparing uninfected mouse (blue text) and HCV-infected liver tissue (mouse samples indicated by black text, patient samples indicated with red text) to a normal liver reference. See legend of Figure 1 for details on clustering, the applied color scheme for the fold changes in the mRNA levels, and experiment representation.

