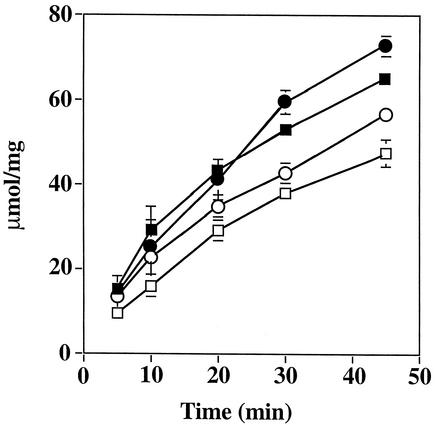
FIG. 4.
ATPase activity in S. sanguis and S. mutans as a function of growth pH values. Extracts were prepared from steady-state cultures of S. sanguis 10904 and S. mutans UA159 grown at the indicated pH values. Error bars represent the ranges from six determinations. The circles represent the UA159 extracts while the squares represent the S. sanguis 10904 extracts. Open symbols represent growth at pH 7 while filled symbols represent growth at lower pH values (pH 6 for S. sanguis or pH 5 for S. mutans).

