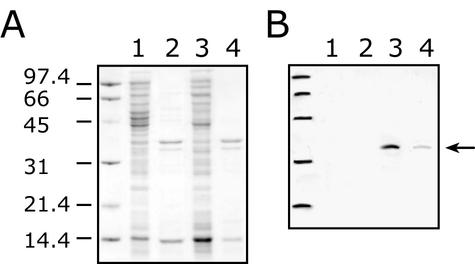
FIG. 2.
Overexpression of His6-tagged WaaZ and cellular location of the protein. (A) Coomassie-stained SDS-PAGE. (B) Corresponding Western immunoblot probed with anti-His5 monoclonal antibody. The analysis was done with BL21(λDE3) containing pWQ153 with and without 1 mM IPTG induction. Cell lysates were prepared by sonication, and the membrane fraction was separated from the soluble fraction by ultracentrifugation. Lanes 1 and 2 represent the soluble and membrane fractions of the uninduced controls, respectively. Lanes 3 and 4 represent the soluble and membrane fractions of the IPTG-induced samples, respectively. The membrane and soluble fractions were prepared such that they were directly comparable in terms of the number of original cells providing the lysate. For loading on SDS-PAGE, the ratio of the protein content in the soluble fraction to that in the membrane fraction was 1:2.5. The numbers on the left represent molecular mass in kilodaltons. The arrow indicates the position of His6-WaaZ.

