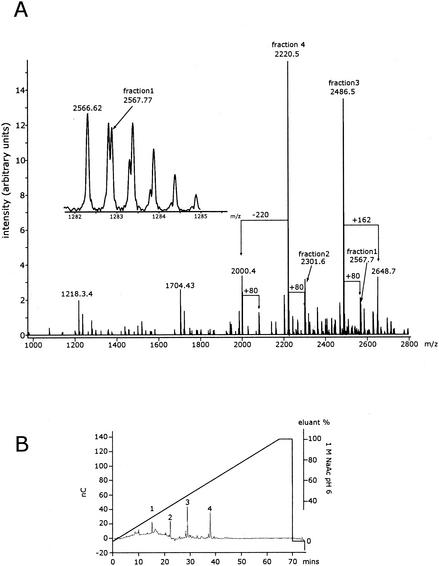
FIG. 7.
Charge-deconvoluted negative-ion ESI FT-ICR mass spectrum of deacylated LPS from E. coli F470(pWQ152) and the major fractions separated by HPAEC. Panel A shows the mass spectrum of the E. coli F470(pWQ152) LPS and the contributions of the 4 HPAEC fractions from panel B. The insert shows the expanded molecular ion region of fraction 1. Panel B shows the HPAEC of the deacylated E. coli F470(pWQ152) LPS. The four oligosaccharide fractions that were isolated by preparative HPAEC are indicated. Peaks 2 and 4 contained 3 Kdo residues and were therefore used for subsequent detailed structural analysis by NMR.

