
Figure 1.
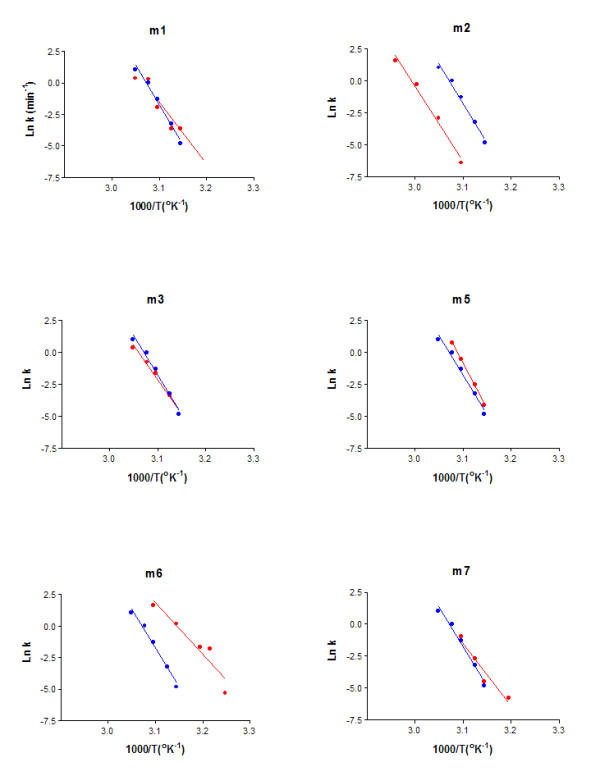
Arrhenius plots of thermal inactivation rate constants of mutated DmAChE (in red) compared to wild type (in blue). k: denaturation first order rate constant (in min-1).
Official websites use .gov
A
.gov website belongs to an official
government organization in the United States.
Secure .gov websites use HTTPS
A lock (
) or https:// means you've safely
connected to the .gov website. Share sensitive
information only on official, secure websites.
Arrhenius plots of thermal inactivation rate constants of mutated DmAChE (in red) compared to wild type (in blue). k: denaturation first order rate constant (in min-1).