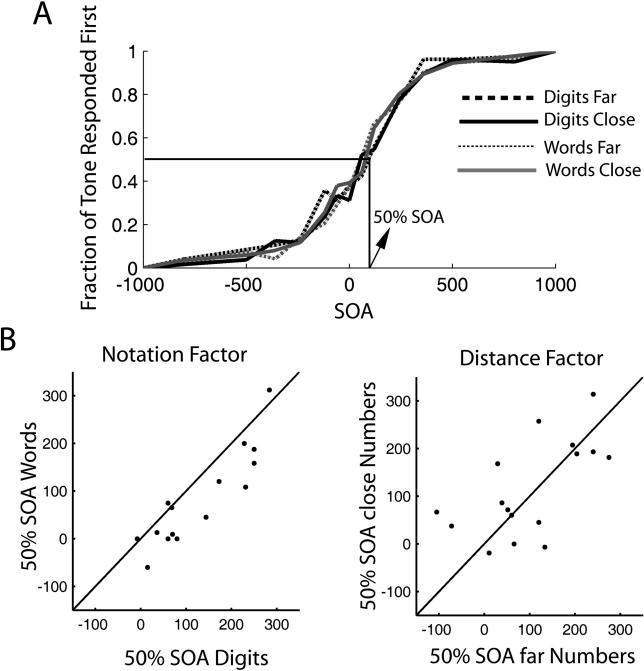
Figure 1. Determinants of Task Choice.
(A) Average proportion of trials in which participants responded first to the tone task as a function of SOA. The center of the distribution (50% of responses to each modality) is at 103 ms, indicating that there is a bias to respond first to the number task. The notation manipulation results in a significant change of the 50%SOA (37.8 ms), but the distance manipulation does not.
(B) Participant by participant measures of the 50%SOA computed separately as a function of notation and distance. The line corresponds to the identity line. For the notation factor, almost all points lie on one side of the curve, indicating that 50%SOA is systematically larger for Arabic digits. For the distance factor, all values are scattered on both sides of the identity line.

