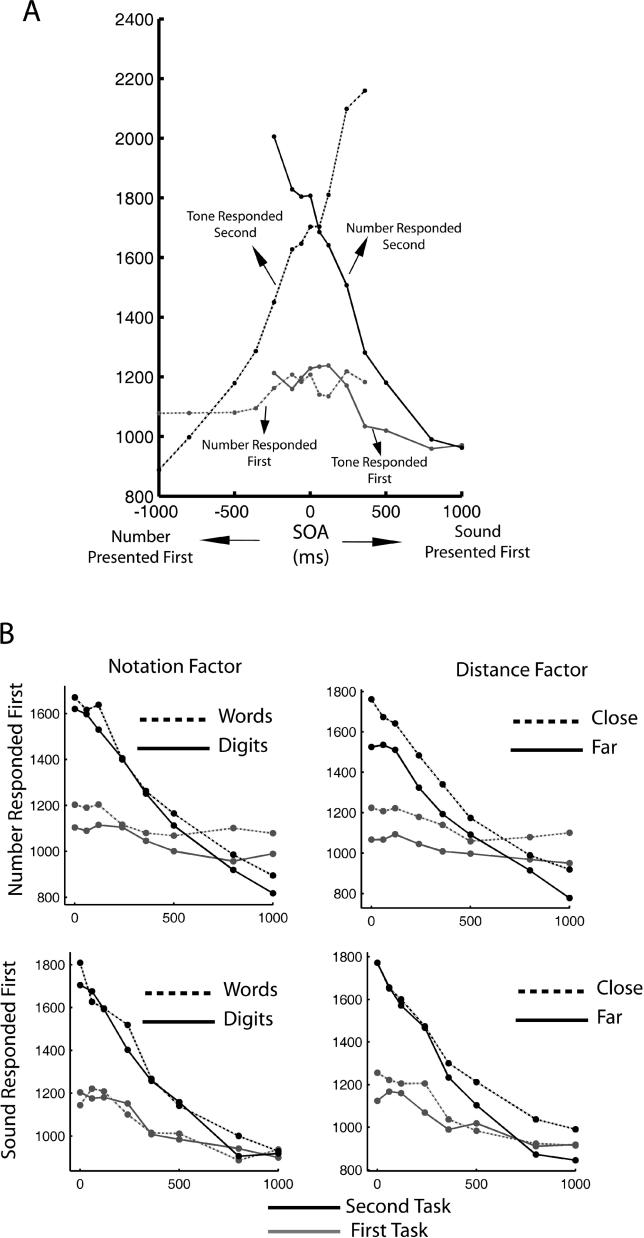
Figure 2. Mean Response Times: A Trace of Different Sources of Interference.
(A) Response times to the first and second tasks as a function of SOA. The labels indicate whether the first task corresponds to the number task (mostly for negative SOAs) or to the tone task (mostly for positive SOAs). Two main effects are observed: (1) Responses to the first task are slowed for small SOAs (<400 ms). This increase shows a fairly sharp transition. (2) Response times to the second task decrease linearly for small SOAs, reflecting a processing bottleneck.
(B) When the number task is presented and responded to first (top two panels), the manipulations of the number task have an additive effect (independent of SOA). This effect propagates to the tone task. When the tone task is presented and responded to first (bottom two panels), it is not affected by manipulations of the number task (as predicted by a sequential processing model)

