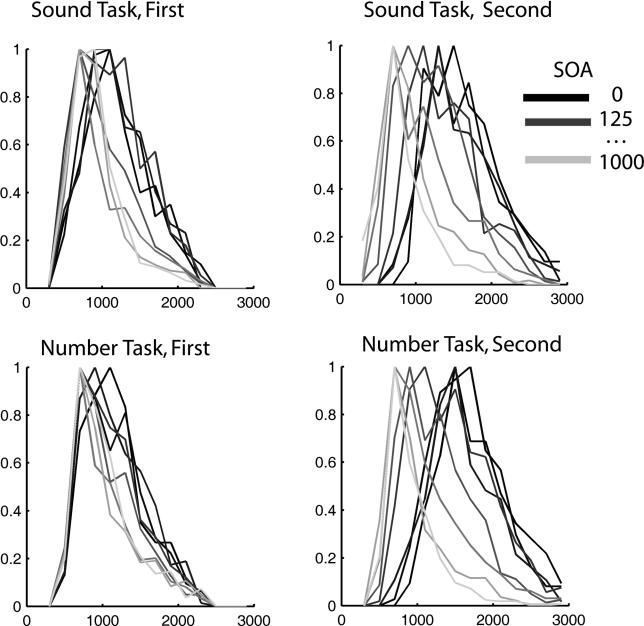
Figure 3. Distribution of Response Times for the First and Second Task: Delayed Decision or Inserted Stage?
Distribution of response times to the first task (left) and second task (right). For clarity, all distributions were normalized to a peak of 1. In both cases, the mean response times increase with decreasing SOAs. From the distributions, it is seen that these effects result from qualitatively different changes. Although increases in the second task result from a delayed onset and widening of the distribution (consistent with the insertion of a variable delay in every single trial due to the processing bottleneck), the onset of the distributions of the first task, for different SOAs, is unchanged. The latter indicates that the increase in the mean response times with SOA for RT1 does not result from the inclusion of a processing stage for each trial. Rather, it results either from a variable lengthening of an already-existing decision stage or from the insertion of such a stage on only some proportion of trials.

