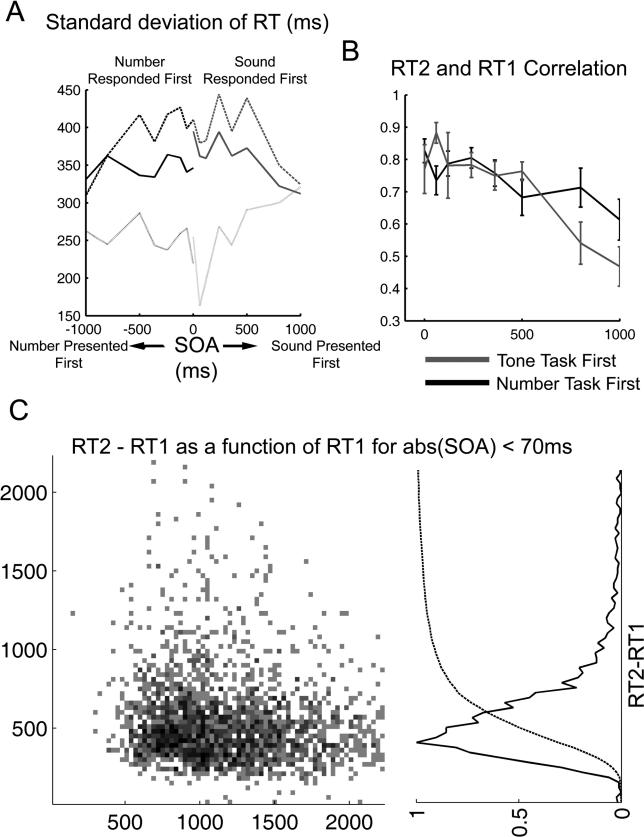
Figure 4. Standard Deviation and Correlation of the Responses to Both Tasks.
(A) Standard deviation of response times to the first and second task, and of the difference in response times. For short SOAs, the response time to the second task is more variable, consistent with a model of accumulation of variance in successive stages. The variance of RT2-RT1 is considerable smaller than the variance of RT1 and RT2 at long SOA indicating a strong correlation between the two responses.
(B) An explicit measure of the correlation between RT1 and RT2 shows a monotonic decrease with SOA, but even for a SOA of 1,000 ms, they are strongly correlated. This correlation cannot be accounted for by momentary drifts in participants' attention since the correlation between response times of consecutive trials is 0.08 ± 0.06 ms.
(C) The left panel shows a histogram of occurrences of RT2-RT1 as a function of RT1. All the data corresponding to SOA values of −60, 0, or 60 ms (simultaneous or quasi-simultaneous presentation) were grouped and binned in windows of 30 × 30 ms. For reference, a line indicates the value of RT2-RT1 = 150 ms. Almost no responses fall below this line. On the right is shown the histogram and the cumulative distribution of RT2-RT1 (collapsed across all values of RT1).

