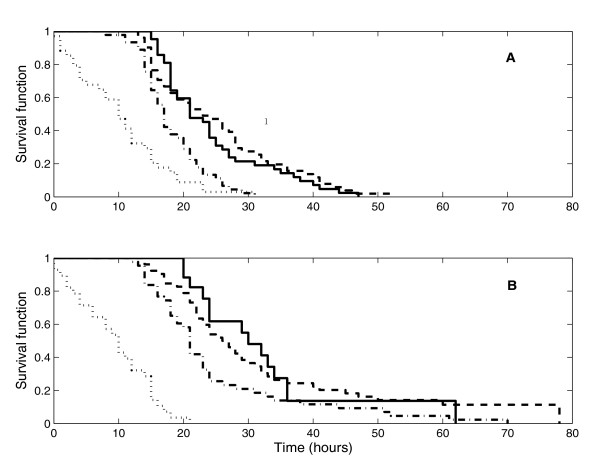
Figure 1.
Kaplan-Meier survival curves for the mitotic cycle time across generations. Generation 1 – dotted line, Generation 2 – dash-dotted line, Generation 3 – dashed line, Generation 4 – solid line. Top panel presents data without thyroid hormone; bottom panel shows data with thyroid hormone in the culture medium.

