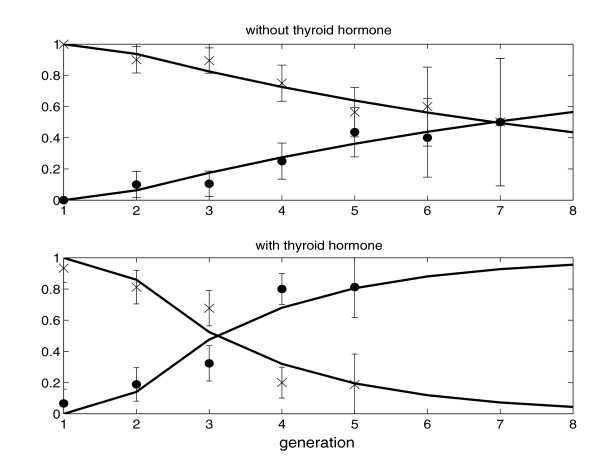
Figure 3.
Conditional (given that the cell does not die before the event of interest) probabilities of division (×) and differentiation (circles) of O-2A/OPCs with (lower panel) and without (upper panel) thyroid hormone. The solid lines correspond to the fitted probabilities of division and differentiation, and each error bar indicates two standard errors for the empirical proportion.

