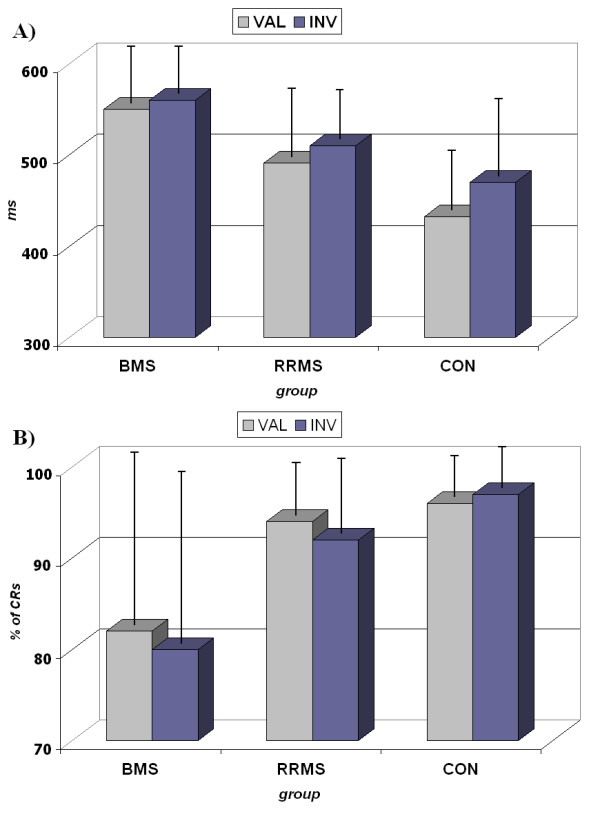
Figure 1.

Behavioural results. 2A. Response times (RTs) for valid and invalid cues. Notice (i) the shorter RTs in the valid cue with respect to invalid cues (except in the BMS group) and, (ii) the shorter RTs in the Control group with respect to the MS groups 2B. Percentage of Correct Responses (CRs). Notice the low number of hits in the BMS group. CON: Control Group; RRMS: relapsing-remitting group; BMS: benign group.
