Figure 3.

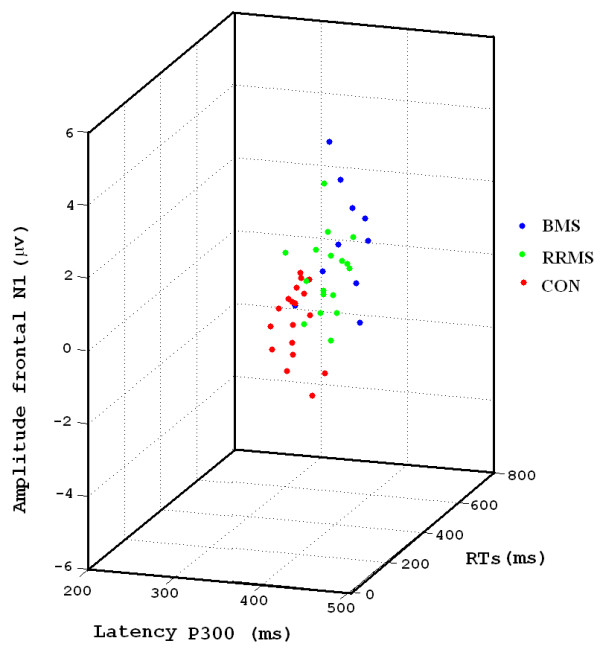
3D scatter-plot that represents RTs, P300 latency and amplitude of the N1 frontal for the different groups. Notice that each group occupies a region in the 3D space.

3D scatter-plot that represents RTs, P300 latency and amplitude of the N1 frontal for the different groups. Notice that each group occupies a region in the 3D space.