Figure 1.

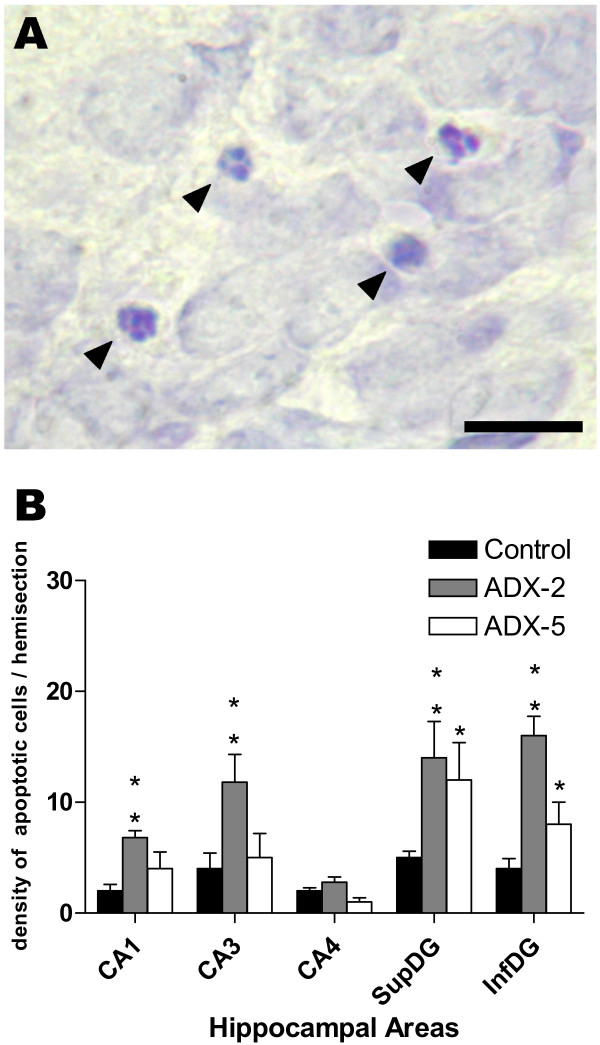
Adrenalectomy (ADX) induced apoptosis in hippocampus. Brain sections from 2-day (ADX-2) and 5-day (ADX-5) adrenalectomized animals were stained with 1% Cresyl Violet and the density of apoptotic cells in the left hippocampus was estimated. Apoptotic cells were counted in ten non-successive 14 μm thick sections at 100× magnification in Cornus Amonnis area (CA1, CA3, CA4) and supra- (SupDG) and infra- (InfDG) pyramidal layer of the dentate gyrus (DG). (A) Images illustrating the morphology of apoptotic nuclei (small condensed nuclei, extensive and tight condensation of nuclear material into darkly stained balls or disassembled pyknotic cells). (B) Bar graph represents the mean ± SEM (4–5 animals per group) of the density of apoptotic cells counted in each area for sham-operated animals (black columns), 2 days after ADX (dashed column) or 5 days after ADX (open column); the values obtained in 2-day and 5-day sham-operated animals were pooled because no differences were observed with time after the sham operation. The data was analysed using the non parametric Kruskal-Wallis test, followed by Dunns post-hoc test. * p < 0.05 and ** p < 0.01 compared to the corresponding sham-operated control. Scale bar = 20 μm.
