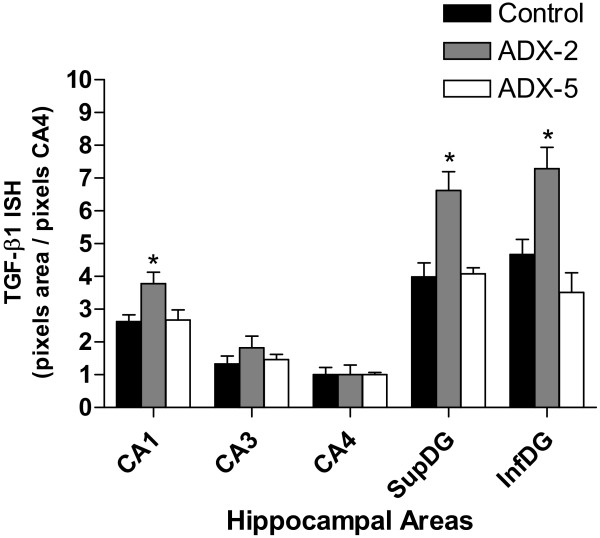
Figure 3.

TGF-β1 mRNA levels increased in CA1 and the dentate gyrus 2 days after ADX. For semiquantitative analysis of TGF-β1 mRNA levels, densitometric measurements of each hippocampal subfield were performed using UN-SCAN-IT software (Silk Scientific Inc. Orem, UT, USA). The relative intensity of the hybridisation signals (pixels) in the different hippocampal regions was converted to a linear gray scale by assigning the highest optical density to the darkest staining and viceversa. The hybridisation signal in the stratum radiatum was considered as background and was subtracted from the optical density values obtained in the hippocampal cell layers. Bar graph represents the data expressed as optical density (pixels) normalized to the CA4 area. For each animal the value represents the average of measurements from 4–5 brain sections. Black bars, control animal; hatched bars, 2 days after ADX; open bars, 5 days after ADX. * p < 0.05 vs control
