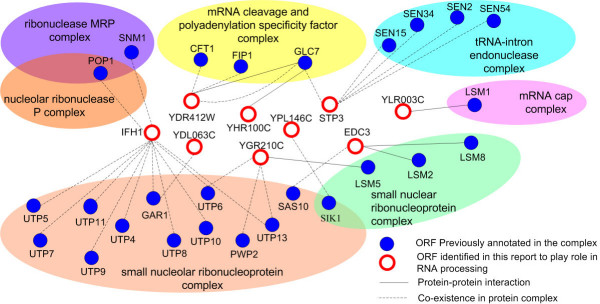
Figure 5.

Schematic representation of proteins contributing to RNA processing and their interaction network. Proteins previously annotated to certain protein complexes and that have a role in RNA processing are shown in blue, and proteins assigned in this report are white, outlined in red. The protein-pair identified by protein–protein interactions are represented as black lines, and those identified by their co-existence in a protein complex as dashed black lines. New assigned proteins or ORFs were fetched by a query using a conservative precision ≥ 0.7. For figure clarity, the count of protein-pair between two proteins is not shown here (one protein-pair is often supported by multiple evidences in our dataset).
