Figure 6.
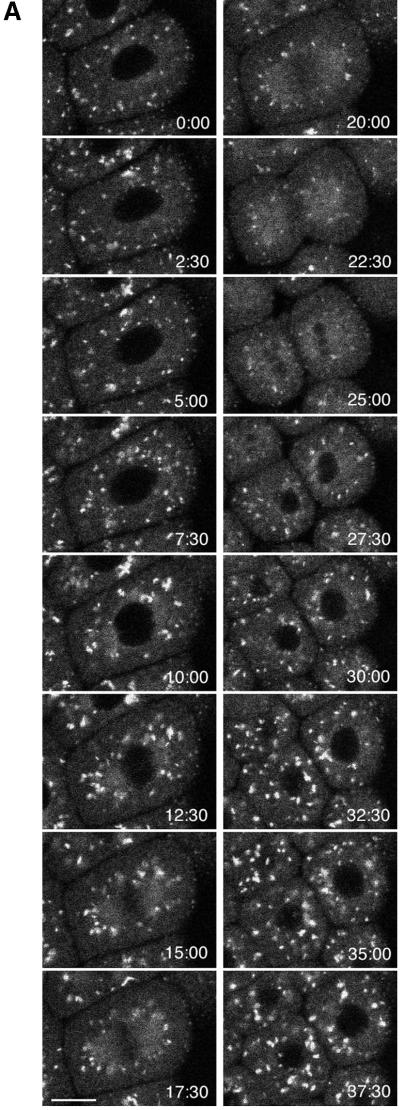
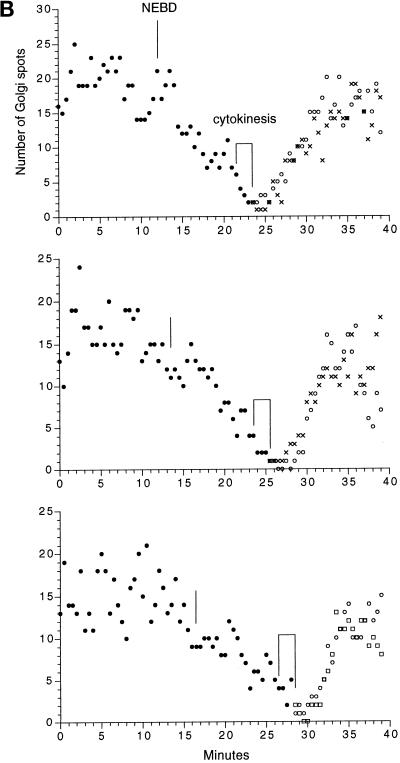
Time-lapse sequence of the Golgi during mitosis. (A) Images of KDELRm-GFP were obtained every 30 s during the seventh cleavage; the timing of the images shown is indicated. (B) Time course of the number of Golgi spots in three different blastomeres. There was some uncertainty in counting. The Golgi that were located farther away from the focal plane gave rise to a progressively more hazy image, and sometimes it was difficult to determine whether an image corresponded to one or two separate Golgi. During interphase, the spots probably correspond to stacks seen by electron microscopy (Figure 2), but the average size of the spots is smaller during mitosis, and it is not known what they correspond toultrastructurally. Last, with this magnification, illumination level, and acquisition settings, the smaller spots seen in Figure 8 were not visible. For the measurements shown here, the spots counted were ≥1 μm in dimension and had a distinct outline. The data document a general trend, which is that the number of Golgi spots begins to decrease soon after NEBD, is at a minimum soon after cytokinesis is completed, and increases rapidly afterward. The original data are shown at http://www2.uchc.edu/mitosis. The top graph contains data from the cell shown in the image sequence. Bar, 10 μm.


