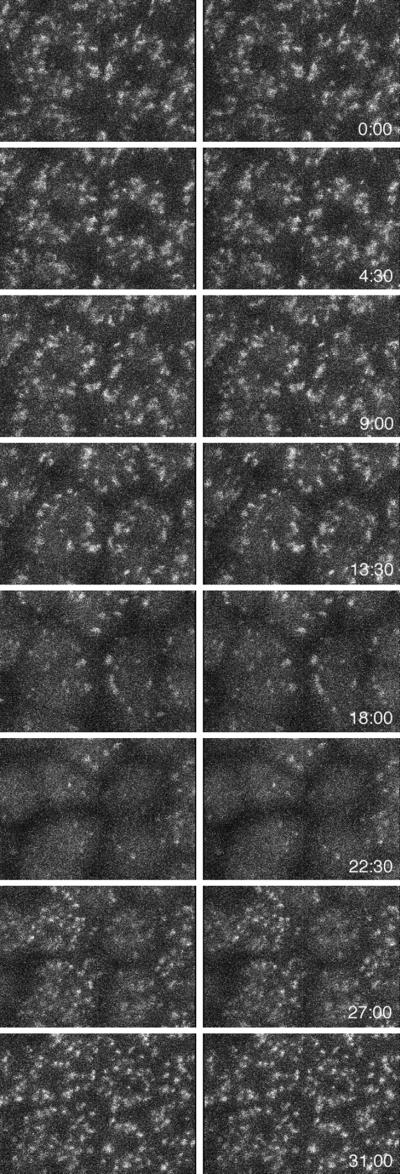
Figure 7.
Time sequence of z series during mitosis of an embryo expressing KDELRm-GFP. z series sequences were obtained at 45-s intervals during the seventh cleavage and consisted of 11 sections 2 μm apart. Every sixth z series is shown here (4.5-min intervals). The z series stack for each time point has been projected as a stereo pair. This sequence shows that the decrease in the number of Golgi in one optical section seen in Figure 5 corresponds to a decrease in the number of Golgi throughout the cell rather than a redistribution of the Golgi out of the plane of the optical section.

