Figure 8.
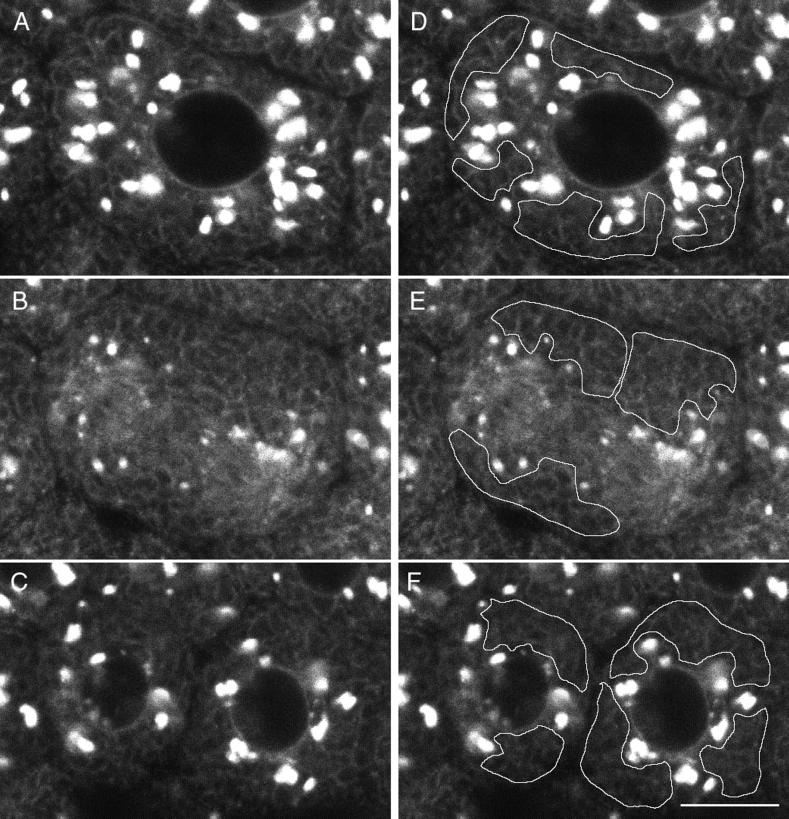
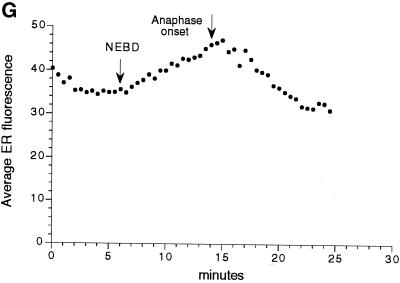
Higher magnification of Galtase-GFP during mitosis. Cells were imaged with a 63× NA 1.4 objective lens as in Figure 5 but at zoom 3 instead of zoom 1. In addition, the laser illumination level was increased threefold, and the length of time for collecting fluorescence emission per pixel was increased threefold, so that the brightness of the image was increased ∼10-fold. As a consequence, the fluorescence from the Golgi was saturated, but the ER and other staining could be observed. The images are a two-frame average (slow scan = 3.1 s per frame) and are part of a sequence taken at 30-s intervals (the complete sequence can be viewed at http://terasaki.uchc.edu/mitosis). (A) Interphase, 6 min 30 s before NEBD of the seventh cleavage occurred. (B) Fifteen minutes after the first image, using identical instrument settings. Golgi spots of interphase cells are no longer prominent, but smaller spots are present throughout the cytoplasm. The ER pattern also appears to be brighter. (C) Twenty-four minutes after the first image. (D–F) The average fluorescence was determined within regions that contained only ER profiles. These areas excluded spots and were intended to measure Galtase-GFP fluorescence in the ER. (G) Average fluorescence versus time for each time point of this image sequence, using area tracings similar to that shown in D–F. The first time point corresponds to A and D, and the last time point corresponds to C and F. The data were used for calculating the ratio of fluorescence in the ER of untreated mitotic versus interphase cells. Bar, 10 μm.


