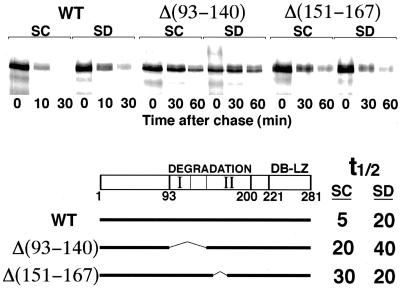
Figure 6.
Effect of deletions in Gcn4 on the sensitivity to starvation. Full-length Gcn4 and two deletions fused to LacZ were subjected to pulse–chase analysis without (SC) or with (SD) prior mild starvation (15 min in medium lacking amino acids). Note the difference in time scale. t½ indicates the half-lives of the three proteins under both conditions as derived from quantitation of the data by phosphorimager. “DEGRADATION” denotes the minimal region of Gcn4 required for degradation, and “I” and “II” indicate the two domains of that region, as defined by deletion analysis (see text). “DB-LZ” denotes the DNA binding domain and the leucine zipper domain of Gcn4.

