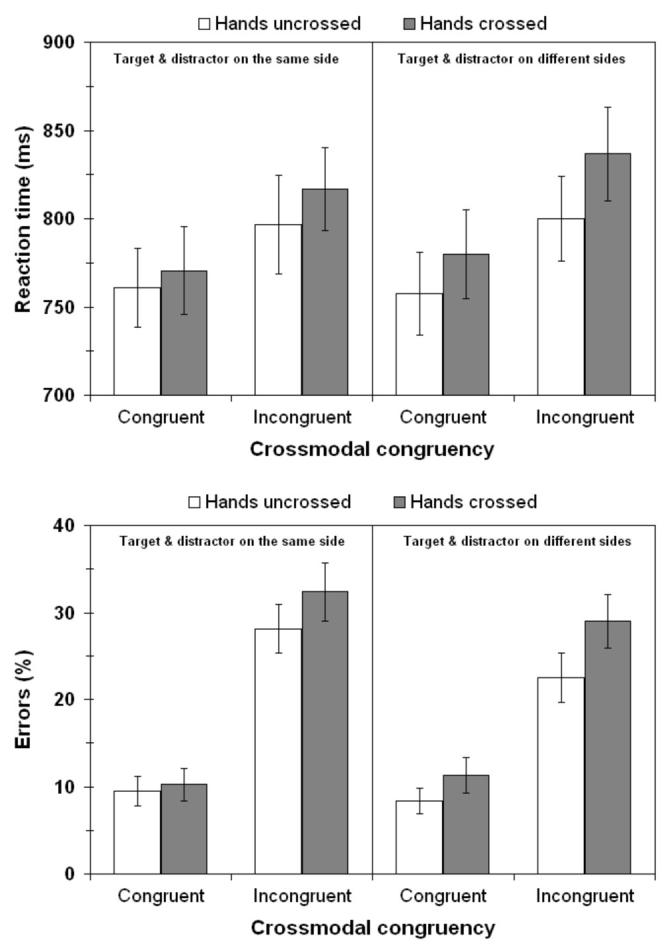
Figure 1.

Results of Experiment 1: Vibrotactile judgements with visual distractors. Columns show the mean of median reaction time (RT) data (upper panel), and percentage error (lower panel). Open columns- hands uncrossed; Filled columns-hands crossed. Errors bars - standard errors of the means across participants. The left half of each chart shows responses for vibrotactile and visual stimuli presented from the same side of space. The right half of each chart shows responses for vibrotactile and visual stimuli presented from different sides of space. Congruent - vibrotactile and visual stimuli of the same type (single vs. double); Incongruent - vibrotactile and visual stimuli of different types.
