Abstract
A method for improving the identification of peptides in a shotgun proteome analysis using accurate mass measurement has been developed. The improvement is based upon the derivatization of cysteine residues with a novel reagent, 2,4-dibromo-(2′-iodo)acetanilide. The derivitization changes the mass defect of cysteine-containing proteolytic peptides in a manner that increases their identification specificity. Peptide masses were measured using matrix-assisted laser desorption/ionization Fourier transform ion cyclotron mass spectrometry. Reactions with protein standards show that the derivatization of cysteine is rapid and quantitative, and the data suggest that the derivatized peptides are more easily ionized or detected than unlabeled cysteine-containing peptides. The reagent was tested on a 15N-metabolically labeled proteome from M. maripaludis. Proteins were identified by their accurate mass values and from their nitrogen stoichiometry. A total of 47% of the labeled peptides are identified versus 27% for the unlabeled peptides. This procedure permits the identification of proteins from the M. maripaludis proteome that are not usually observed by the standard protocol and shows that better protein coverage is obtained with this methodology.
The primary goal of a proteomic analysis is to be able to systematically identify and quantify the majority of proteins expressed in a cell or tissue.1,2 The conventional approach for conducting proteome-wide studies is two-dimensional polyacrylamide gel electrophoresis (2D-PAGE),3 where a large number of proteins can be separated on the basis of their isoelectric point and molecular weight. Although 2D-PAGE technology has been the chief technology for proteomic analysis to date, it has recognized limitations, such as a bias toward the most abundant proteins and dynamic range and protein solubility issues that complicate the detection and separation of low-abundance and hydrophobic proteins.4 In recent years, a number of researchers have focused on improving proteomic analyses via the development of shotgun proteomic methods.5–9 These methods identify and quantify proteins that have not been separated prior to digestion. The basis of this approach is to perform a batch digestion of an unseparated protein mixture, to separate the resulting peptides by one or more dimensions of liquid chromatography, and to identify the proteins from which the peptides derive by mass spectrometry analysis.8
Two mass spectrometry approaches for shotgun proteomic analysis have been reported. First is the use of tandem mass spectrometry to generate fragmentation data, which can be used by search engines to identify the protein origin of the peptides.2,6,8,10,11 These methods are able to detect and identify a wide variety of protein classes including those with extremes in isoelectric point, molecular weight, abundance, and hydrophobicity. However, these methods are time-consuming and produce very large data sets, as they require the generation of a fragmentation spectrum for each peptide in a mixture that contains thousands of components. A second approach is the use of accurate mass measurement to identify proteins. If the molecular masses of the peptides from a batch digest are measured with high enough mass measurement accuracy (MMA), a reasonable fraction of their masses can uniquely identify them by comparison to a list of masses for all of the possible proteolytic peptides predicted from an in silico digest of the genome. Other experimental information can be used to increase the fraction of identified peptides, for example, HPLC retention time.11 Methods that combine MMA with the MS/MS capabilities have also been reported.11,12
In this paper, we describe a new method for improving the specificity of protein identification by accurate mass measurement of peptides. The improvement is based upon the derivatization of a specific amino acid with a reagent that changes the mass defect of the peptide. For the purpose of discussion, we refer to the mass defect as the difference between the exact monoisotopic mass of a compound and its nominal molecular weight, that is, the weight based on the nucleon values of the most abundant isotope of each element, e.g., 12 amu for C, 16 amu for O, etc. Peptides are composed principally of elements from the first two rows of the periodic table. These elements have mass defects that lie in the range of ± 0.008 amu. The mass defect of peptide molecules is ~+0.05 amu/100 amu of molecular weight, i.e., a 1-kDa peptide has a mass defect of ~+0.5 amu, and a 2-kDa peptide has a mass defect of ~1 amu. The positive mass defect is a result of the high stoichiometric proportion of hydrogen atoms in a peptide molecular formula (the hydrogen mass defect is +0.0078 amu). Although peptide molecules have significant mass defects because of the large number of atoms from which they are assembled, the distribution of mass defects is generally narrow, causing peptide molecular weights at any given nominal mass to occupy only a small portion of a unit mass. This is illustrated in Figure 1, which shows a histogram of monoisotopic masses for the 125 possible tryptic peptides (up to 1 missed cleavage) with molecular weights between 1500 and 1503 that one predicts for all proteins in the sequence database for the organism Methanococcus maripaludis. This organism has 1722 open reading frames, which is about average for a single-cell organism, and has ~95 700 predicted tryptic peptides with molecular weights above 700 amu (allowing up to 1 missed cleavage), and the predicted peptide mass distribution is similar to that of any organism. Because of the narrow distribution of mass defects for peptides, their molecular weights cluster into one-third of the total mass space causing masses to overlap and reducing the specificity of a peptide mass for identifying the protein origin. Greater specificity would be possible if the peptide masses were distributed more evenly across the mass scale.
Figure 1.
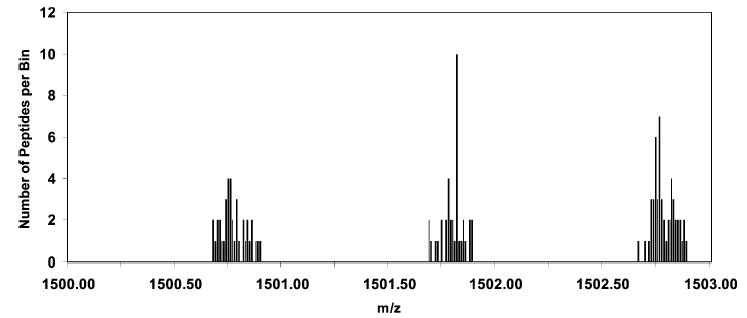
Histogram of the molecular mass distribution of the predicted tryptic peptides of M. maripaludis over the range 1500–1503 Da, Illustrating the distribution of mass defects of peptides. The bin size is 0.01 amu. Peptide masses are observed to cluster in approximately one-third of the available mass space.
The narrow distribution of mass defects for a compound class has been noted previously by other researchers in mass spectrometry. Perfluoroalkanes have distinctly different mass defects that do not overlap those of most other organic compounds and have long been employed as internal calibrants for exact mass measurements.13 The components of complex mixtures of small molecules can be assigned a Kendrick mass defect value, which allows homologous series to be assigned to various compound classes.14–19 Labeling the N-terminus of a protein with a compound that alters the mass defect is used to distinguish the N-terminal peptide fragments from C-terminal and internal fragments produced by nozzle–skimmer dissociation of intact proteins and is the basis of a commercial reagent (IDBEST) and process.20,21 We report here a method for altering the mass defects of a selected fraction of the peptides in a batch digest of a proteome so that the resulting peptides can be more readily identified by accurate mass measurement.
EXPERIMENTAL SECTION
Reagent Synthesis
The cysteine-alkylating reagent, 2,4-dibromo-(2′-iodo)acetanilide, was prepared by addition of 5.4 mmol (0.46 mL) of oxalyl chloride (Acros Organics, Morris Plains, NJ) in 2.7 mL of dry dichloromethane to 1 equiv (1 g) of 2-iodoacetic acid (Acros Organics) in 4 mL of dry dichloromethane. This mixture was stirred for 3 h at 0 °C under nitrogen to yield a pink solution (2-iodoacetyl chloride.) This solution was added dropwise with stirring to 1 equiv (1.3 g) of 2,4-dibromoaniline (Acros Organics) in 10 mL of dry dichloromethane. A white crude solid appeared as a precipitate and was collected by filtration and purified by recrystallization from hot water to give the final product in 70% yield. The structure of the purified 2,4-dibromo-(2′-iodo)acetanilide was confirmed by 1H NMR and mass spectrometry (NMR and MS spectra are included as Supporting Information.). All reagents and solvents were used as purchased without further purification.
Protein Labeling
The labeling of cysteine before versus after tryptic digestion was compared for a number of proteins. We consistently find that the best results are obtained by labeling before digestion, as it is easier to remove the excess labeling reagent from a protein solution than from a solution of lower molecular weight peptides. Each protein standard was dissolved in alkaline solution (10 mM ammonium bicarbonate) to make a 1 mg/mL solution and denatured by heating at 95 °C. Disulfide bonds were reduced by addition of tris(2-carboxyethyl)phosphine (Pierce Biotechnology, Rockford, IL). The protein then underwent reaction with a 100-fold molar excess of 2,4-dibromo-(2′-iodo) acetanilide at pH 8 for 90 min in the dark at room temperature. Prior to trypsin digestion, the derivatized protein was subjected to centrifugal size exclusion chromatography using a 3-mL spin column packed with Sephadex G-25 (Aldrich, St. Louis, MO) to remove excess 2,4-dibromo-(2′-iodo) acetanilide. Trypsin digestion was performed under standard conditions (Promega, Madison WI), i.e., at 37 °C, pH 7, for 18 h.
Proteome Labeling
Whole cell lysates were extracted from M. maripaludis that was grown on minimal media with ammonium sulfate as the sole source of nitrogen. Cells were grown using ammonium sulfate both with the naturally occurring isotopic composition (99.6% 14N, 0.4% 15N) and with 98% 15N-enrichment. The cells were concentrated by centrifugation at 10 000 rpm for 30 min; lysis of the cells was performed with a French press. DNA was digested and removed from the extract by adding DNAase to the sample followed by centrifugation. Equal amounts of protein extracts were mixed together before batch trypsinolysis. Prior to denaturing and labeling of the proteome, small molecules were removed by centrifugal size exclusion spin columns packed with Sephadex G-25. Subsequent treatment of the sample followed the procedure described above for labeling of the protein standards. Total protein concentrations were determined spectrophotometrically measuring at 562 nm using a bicinchoninic acid protein assay kit (Pierce).
Mass Spectrometry
Samples were analyzed by matrix-assisted laser desorption/ionization (MALDI) Fourier transform ion cyclotron resonance (FTICR) mass spectrometry using a 7-T magnet (Bruker Daltonics Inc, Billerica, MA). This instrument is equipped with a SCOUT 100 MALDI source, which desorbs ions at elevated pressure (~1 mTorr) to suppress metastable decomposition. Conditions for operation of the FTICR MS were similar to those reported previously,22 and external mass calibration was established using a peptide mixture generated by tryptic digestion of chicken egg albumin (Sigma, St. Louis, MO). The MALDI matrix was 2,5-dihydroxybenzoic acid (DHB) (Lancaster, Pelham, NH).
High-Performance Liquid Chromatography
Separations of peptide mixtures were performed on an UltiMate Plus, FAMOS by Dionex (Sunnyvale, CA). Reversed-phase columns used were as follows: (1) 75 μm i.d. × 15 cm, C18 PepMap100, 3 μm, 100 Å; (2) 75 μm i.d. × 15 cm, C8 PepMap100, 3 μm, 100 Å (LC Packings-Dionex). Mobile phase A was water/acetonitrile/trifluoroacetic acid (98:2:0.1 by volume), and mobile phase B was acetonitrile. A gradient from 0 to 100% B over 90 min was used at an approximate column flow of 300 nL/min; the total run time was 120 min. The eluate was collected onto a stainless steel MALDI target at 60-s intervals using a Probot Micro Fraction Collector (LC Packings-Dionex). The MALDI matrix was added after the fraction collection was completed, requiring resuspension of the dried, fractionated peptides in 0.5 μL of the matrix solution (1 M DHB in 50:50:0.1 water/acetonitrile/trifluoroacetic acid.)
Protein Identification
The molecular weight of the peptides and their nitrogen stoichiometry were determined from the MALDI-FTICR mass spectrum. The number of nitrogen atoms in each peptide was determined from the mass separation between the monoisotopic peak of the peptide containing the natural distribution of 14N/15N and the monoisotopic peak of the 15N-enriched counterpart. The data were analyzed using software that was developed in-house to identify the proteins from which the peptides were derived. The software compares the experimentally determined molecular weight and nitrogen stoichiometry with values in a look-up table that is populated with the predicted tryptic fragments (up to 1 missed cleavage) for all protein sequences for the organism in question. A peptide is considered to be identified when there is only one predicted peptide that meets the following match criteria: the predicted peptide has a mass that lies within a specified mass tolerance of the measured molecular weight, and it has the same nitrogen stoichiometry as the measured value. Peptide identifications were made using a mass tolerance of 10 ppm.
RESULTS AND DISCUSSION
Mass Defect Labels
The narrow distribution of mass defects that is characteristic of peptides arises in part from the small mass defect of their component elements and from the uniform stoichiometry of peptides. Table 1 shows the mass defect of the elements that comprise proteins. As can be seen, their mass defects are small (less than 10 mmu for H, C, N, and O, and ~28 mmu for S). The average elemental ratio for an amino acid residue is C4.9384H7.7583N1.3577O1.4773S0.0417.23 Given that nitrogen (mass defect, +3.1 mmu) and oxygen (mass defect, −5.1 mmu) have comparable stoichiometric values, their mass defects tend to cancel in a peptide. One can see that the mass defect of a peptide is principally due to hydrogen and that the distribution of mass defects comes from the narrow distribution of elemental stoichiometries. Figure 1 suggests that the distribution of mass defects at any nominal mass is roughly one-third of an amu. One can calculate the distribution of mass defects at each nominal mass for the tryptic peptides of all proteins in a database, and we have done this for peptides with masses from 700 to 3000 that derive from the proteins in the M. maripaludis database. The composite distribution of mass defects around the average value at each nominal mass is shown in Figure 2A. As can be seen, peptides masses occupy only one-third of the available mass scale, which causes some of the predicted masses to overlap, even at a mass tolerance of 10 ppm. To shift some of the peptide masses to the region of the mass scale that is unpopulated, we alter the mass defects of a portion of the peptides by derivatizing a less frequently occurring amino acid, cysteine, with a reagent that introduces a large mass defect. This is accomplished by introducing a heavy element with a large mass defect into the elemental composition, in this case, bromine.
Table 1.
Mass Difference from Nucleon Value of the Most Abundant Isotope of the Elements Found in Proteins
| element | mass defect (amu) |
|---|---|
| 12C | 0 |
| 1H | 0.0078 |
| 16O | −0.0051 |
| 15N | 0.0031 |
| 32S | −0.0279 |
Figure 2.
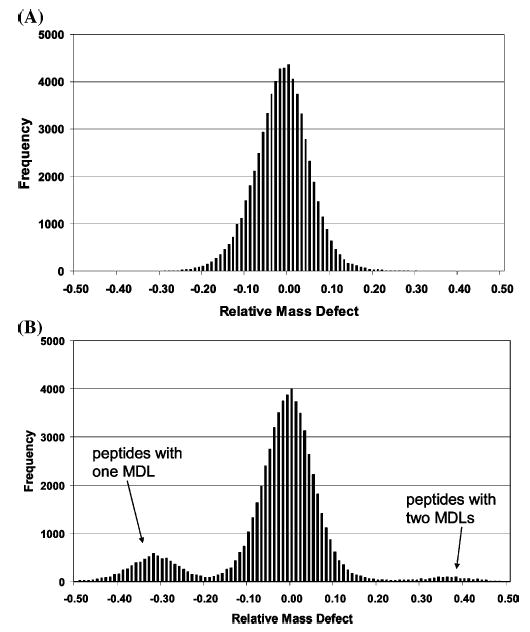
(A) Composite distribution of mass defects for all tryptic peptides of M. maripaludis with molecular weights between 700 and 3500 amu. The horizontal axis is the mass difference (amu) between a peptide’s mass defect and the average mass defect for all peptides of the same nominal mass. (B) The composite distribution when all the cysteine-containing peptides have been labeled. The central distribution corresponds to all peptides that do not contain cysteine. All singly labeled cysteine-containing peptides appear in the smaller distribution centered at −0.30 amu. Doubly labeled cysteine-containing peptides appear at +0.40 amu.
Derivatization of a specific amino acid with a compound that affects the mass defect will yield two sets of peptides: unlabeled peptides with typical mass defects, and labeled peptides with masses that lie in a region of the mass scale that is unoccupied by underivatized peptides. To achieve this end, we have synthesized a reagent that we refer to as a mass defect label (MDL), which derivatizes a specific type of amino acid and which changes the mass of the resulting product in a manner that makes it easy to distinguish derivatized peptides from other peptides of the same nominal mass. The ideal tagging reagent will (1) have high reaction specificity for a low-abundance amino acid such as cysteine or tryptophan, (2) introduce a mass defect shift of 0.3–0.6 amu, (3) be stable to the chemical and physical conditions necessary for derivatization and mass spectral characterization, and (4) have no deleterious effects on peptide solubility or ionization efficiency. The MDL reported here is a derivative of iodoacetamide and reacts specifically with cysteine, as shown in Figure 3. Figure 2B illustrates the change in the mass defect distribution for the tryptic peptides that is expected from cysteine derivatization of all the proteins in the M. maripaludis sequence database. The derivatized peptide masses occupy a region in which no unlabeled peptides are found, ~0.3 amu below the unlabeled peptides. Because only 15–20% of tryptic peptides contain cysteine, fewer peptides will occupy the new region of mass, and therefore, there is a lower probability of mass overlap for predicted peptides. This suggests that a higher proportion of derivatized peptides can be identified by their mass compared to underivatized peptides.
Figure 3.
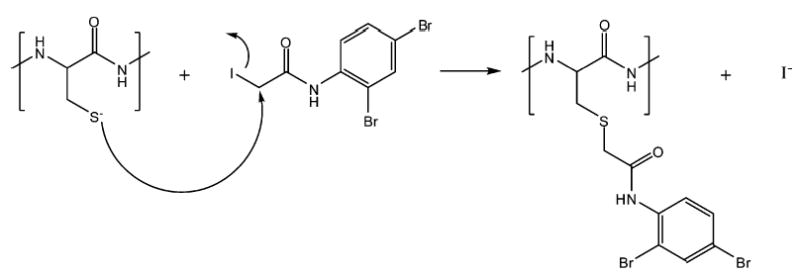
Mechanism of an alkylation reaction of a cysteine-containing peptide with 2,4-dibromo-(2′-iodo)acetanilide.
Labeling of Protein Standards
Several protein standards were tested, including bovine serum albumin (BSA), β-lactoglobulin, ovalbumin, and carbonic anhydrase. These proteins underwent derivatization of their cysteine residues with the MDL, digestion by trypsin, and analysis by MALDI-FTMS. Mass defect labeled peptides could be identified both by their mass defect values and by the isotope pattern that is characteristic of the presence of two bromine atoms. Figure 4 shows the calculated isotopic distribution of a peptide (BSA 445–458) that is labeled by the mass defect reagent and compares the distribution to that of the corresponding unlabeled peptide. The use of chlorine isotope patterns to identify derivatized cysteine-containing peptides in a proteomics assay has been reported previously.24 Here, we do not use the isotopic pattern to establish that derivatization has occurred. The mass defect of the resulting peptide provides this information. However, it is important that the unusual isotopic pattern is taken into consideration when assigning the monoisotopic peak. Figure 5 shows a mass spectrum of the tryptic peptides of bovine serum albumin that has been derivatized with the MDL; peaks corresponding to labeled peptides are identified with a square. As can be seen in the mass spectrum, many of the abundant peaks in the mass spectrum are from derivatized peptides, demonstrating that the MDL does not adversely affect the detectability of the peptides. No nonderivatized cysteine-containing peptides were found in the mass spectra for any of the protein tryptic digests that were tested, suggesting that the derivatization reaction was complete. Bovine serum albumin contains 35 cysteines, and 32 labeled cysteine residues were observed in the mass spectra of the tryptic peptides. Interestingly, in the underivatized control spectrum, only five cysteine-containing peptides were observed, suggesting that this derivatization increases the detectability of the cysteine-containing peptides. For β-lactoglobulin, five out of seven possible cysteines were observed in their labeled state, and for ovalbumin, three out of six labeled cysteines were observed. Bovine carbonic anhydrase II, which does not have a cysteine residue, served as a negative control. No labeled peptides were found in the mass spectrum of its tryptic digest. Overall, these data suggest that the reaction of the MDL reagent is specific for cysteine residues, is quantitative in reactivity (no underivatized cysteines were observed), and has no adverse effect on the detectability of the derivatized peptides by MALDI mass spectrometry.
Figure 4.
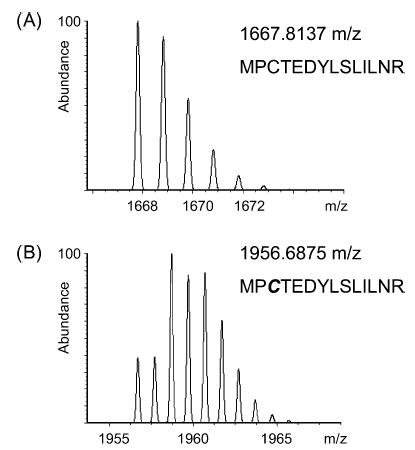
Calculated isotopic pattern for the peptide MPCTEDYLS-LILNR from BSA (residues 445–458) (A) without and (B) with the dibromoacetanilide mass defect label.
Figure 5.
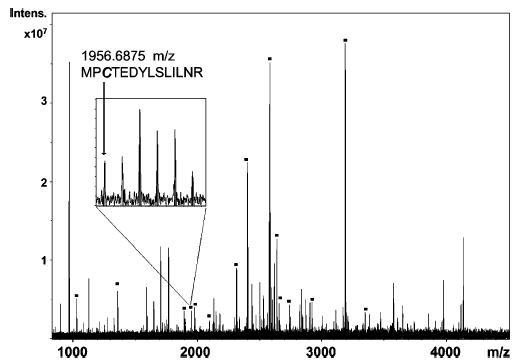
MALDI-FTICR mass spectrum obtained of a BSA digest. Mass defect labeled-peptides are denoted with a box. Inset shows a mass scale expansion of the peaks near m/z 1957, identified as the peptide MPCTEDYLSLILNR, whose predicted isotope pattern is shown in Figure 4B.
Protein Identification
To test the effectiveness of this method for improving protein identification, we derivatized a proteome sample from the organism M. maripaludis. For this experiment, we also use endogenous 15N labeling of protein mixtures to improve the specificity of the protein identification. All proteins from two whole-cell lysates are isolated from two identical cultures, one grown using a nitrogen source (ammonium sulfate) with the natural abundance of 15N and the other with 98% 15N. Equal amounts of protein are then collected from each culture and combined.25 This method is a useful tool to assist with protein identification. Previously, we have found a significant improvement in the ability to identify peptides by accurate mass measurement when nitrogen stoichiometry is used as a search constraint. (Parks, B. A.; Amster, I. J., manuscript in preparation).
M. maripaludis contains 1722 open reading frames (ORFs),26 and 18% of the 95 719 predicted tryptic peptides with up to 1 missed cleavage contain cysteine. The utility of this approach (15N and MDL labeling) to protein identification by accurate mass measurement has been estimated for this organism at a mass search tolerance of 10 ppm; the fraction of unique peptides increases from 8% (unlabeled peptides) to 43% (labeled peptides) when all the possible peptides up to m/z 3500 are taken into account. If only the mass defect labeled cysteine-containing peptides are considered, 75% of the masses are unique (database searching with 10 ppm mass tolerance and using the nitrogen stoichiometry as a search constraint).
Increasing the percentage of identified peptides should increase the number of identified proteins. This was examined for the M. maripaludis proteome. Whole-cell lysates from M. maripaludis were derivatized and digested by trypsin and subsequently fractionated by nano-LC using a C18 column. The fractions were analyzed by MALDI-FTMS. Analysis of the spectra resulted in the assignment of 1449 nonredundant peptides masses. Out of these, 156 (11%) were found to be mass defect labeled peptides. Using these data, a search was made against a list of predicted M. maripaludis tryptic peptide masses. Using a mass tolerance of 10 ppm, this resulted in the identification of 304 proteins using both nitrogen stoichiometry and mass defect labeling, which is an improvement of 14% over the 268 proteins identified when the search is made against a list that does not include the MDL peptides. We have previously analyzed the same proteome (but without mass defect labeling or cysteine alkylation) several times under similar conditions, and we typically identify 250 ± 25 proteins. We attribute the improvement in proteome coverage to the fact that mass defect labeling increases both the detectability and the identification specificity of cysteine-containing peptides. To check the effect of the MDL on the detectability of cysteine-containing peptides, we have made MALDI-FTMS measurements of the tryptic digest products of BSA prepared using three different methods: (1) with no alkylation of cysteine; (2) with alkylation by iodoacetamide (carbamidomethylation); (3) with alkylation by the mass defect label. Each of the three digests were analyzed four times. Of the 35 cysteine residues in BSA, we observe 4–6 (average equals 5) when the cysteines are not alkylated, 8–15 (average 11.3) when cysteines are alkylated by iodoacetamide, and 12–20 (average 15.5) when the mass defect label is used. These data show that the MDL procedure provides 50% better detectability for cysteine-containing peptides compared to carbamidomethylation and 300% improvement compared to peptides with unalkylated cysteines.
Detailed analysis of the data gave some insight into the hydrophobicity of the labeled peptides. Figure 6A shows a graph of the percentage of labeled peptides found per fraction versus the retention time. Most of the labeled peptides eluted from the column after the gradient reaches 50% organic composition. These data suggest that the labeled cysteine-containing peptides are more hydrophobic, consistent with the structure of the mass defect label. Earlier elution and better separation of this sample can be achieved by using a column with a less hydrophobic stationary phase. We have examined the same labeled proteome using a C8 column. Analysis of the data resulted in assignment of 1195 pairs of nonredundant peptides masses, of which 126 (11%) were mass defect labeled peptides. Figure 6B shows the percentage of labeled peptides per fraction versus retention time with the C8 column. The labeled peptides are found to be distributed more evenly throughout the LC separation with the C8 column. Nevertheless, the total number of identified proteins shows a slight decrease when compared with the data obtained using a C18 column (279 versus 304 identified proteins). Based on the results obtained, it appears that earlier elution of mass defect labeled peptides does not seem to positively affect the total number of those peptides observed by MALDI-FTMS.
Figure 6.
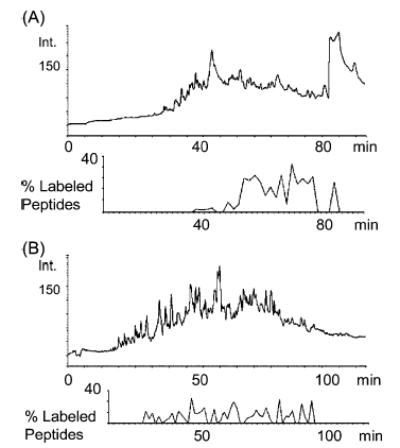
Chromatogram and plot of percentage of labeled peptides versus elution time for (A) C18 column proteome separation and (B) C8 column proteome separation. Percent of labeled peptides was calculated using the total number of peptides observed and the number of MDL peptides found for each fraction collected and then analyzed by MALDI-FTICR mass spectrometry.
Combining both sets of data, the total number of observed peptide pairs (14N/15N) is 6146; 475 of these were found to be labeled with the cysteine-specific reagent. It is useful to use this large data set to examine the improvement in database searching that results from mass defect labeling and metabolic 15N labeling. For peptides without a mass defect label, the fraction of unique peptides goes from 7% when using only the molecular weight to search the database (i.e., no nitrogen stoichiometry data used in search) to 27% for the non-MDL peptides when the nitrogen stoichiometry constraint is used. For the mass defect labeled proteome, the number of unique peptides increases to 2108, which represents 34% of the total number of peptides. If one considers only the peptides labeled by 2,4-dibromoacetanilide, 47% of the peptides are identified. Having a higher percentage of unique peptides increases the number of identified proteins. Indeed, identification of proteins shows that if only the nonlabeled peptides are used, 377 proteins are identified compared to 425 proteins identified when all the found peptides masses are used. These “extra” 48 proteins are not usually identified from the complex mixture of proteins from M. maripaludis by the standard protocol (no cysteine alkylation), demonstrating that better protein coverage is obtained by using the accurately measured masses of mass defect labeled cysteine-containing peptides to identify proteins.
We anticipate significant improvement in this method by refinement of this technique. For example, we note that the percentage of identified peptides obtained in these experiments is lower than one would predict from a statistical analysis of the proteome. The expected identification specificity mentioned above (43% identification for non-MDL peptides, searching at 10 ppm mass tolerance and using the nitrogen stoichiometry as a constraint; 75% identification for MDL-peptides) was calculated using all the possible tryptic peptides in the mass range of 700–3500 amu. Figure 7 shows a plot of the number of peptides observed versus their mass-to-charge ratio for the experiment using a C18 analytical column. Most peptides are found in the range between 700 and 2500 amu. The calculated fraction of unique peptides for the tryptic peptides within this mass range is 36%, which corresponds well with the observed experimental result of 34%. Detection of higher mass peptides can be achieved by optimizing the operational conditions of the instrument MALDI-FTMS. For the instrument used in these studies, by optimizing the higher mass region of the mass range, the sensitivity of the lower mass region is reduced. Recently, it has been demonstrated in our laboratory that by combining data collected using two different sets of tuning conditions the dynamic range for the analysis of a proteome can be improved.22 Another approach to increasing the number of mass defect labeled peptides observed is analyzing them by ESI-MS. It has been found in previous studies that ESI is more favorable for the ionization and detection of hydrophobic peptides than is MALDI.27,28 Therefore, more mass defect labeled cysteine-containing peptides are expected to be observed by using ESI compared to MALDI. This will be the subject of future studies in our laboratory. Combining both MALDI and ESI results could lead to gaining the most information possible out of a particular sample due to their complementary nature.29
Figure 7.
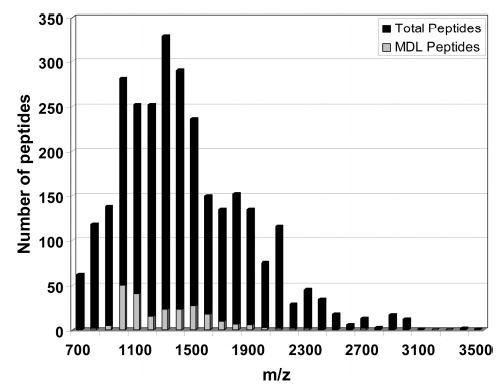
Histogram for all possible tryptic peptides from M. maripaludis within 700 and 3500 amu. Gray bars represent the number of MDL peptides and black bars the total number of peptides for each 100 amu mass bin.
CONCLUSIONS
The method presented here provides a way to improve the specificity of peptide identification based on accurate mass measurement, which leads to an increase in the number of proteins that can be identified in an organism with a small genome (<5000 ORFs). This approach has several significant differences from methods that use derivatives with affinity tags, such as ICAT reagents.30 First, both unlabeled and mass defect labeled peptides are analyzed simultaneously, which eliminates the need for separation prior to analysis and allows the detection of proteins that do not contain cysteine. Second, improvement in specificity arises from the decongestion of the mass spectrum, meaning that regions of the mass space that were previously unoccupied will be populated by the labeled cysteine-containing peptides. Another important advantage of using this approach constitutes the identification of proteins usually missed by other methods; in this case, 48 extra proteins were identified by adding a mass defect tag to the cysteine-containing peptides, as this is found to improve both their detectability and their identification specificity. In addition, the analysis of these samples was performed by MALDI-FTMS without requiring the use of tandem MS, which demands the acquisition of much larger data sets and requires significantly more computational analysis of the data. This approach can be extended to the labeling of other amino acids that occur with lower than average frequency, such as tryptophan or histidine, by using labeling reactions that are specific for these amino acids. Such work is currently under investigation in our laboratory.31
Supplementary Material
Acknowledgments
The authors thank Dr. Iris Porat and Prof. William B. Whitman for the metabolically labeled M. maripaludis proteome. We gratefully acknowledge generous financial support from the National Institutes of Health (R01 RR019767-03) and the National Science Foundation (CHE-0316002).
Footnotes
SUPPORTING INFORMATION AVAILABLE
Additional information as noted in text. This material is available free of charge via the Internet at http://pubs.acs.org.
References
- 1.Gygi SP, Rist B, Aebersold R. Curr Opin Biotechnol. 2000;11:396–401. doi: 10.1016/s0958-1669(00)00116-6. [DOI] [PubMed] [Google Scholar]
- 2.Aebersold R, Goodlett DR. Chem Rev. 2001;101:269–295. doi: 10.1021/cr990076h. [DOI] [PubMed] [Google Scholar]
- 3.Peng J, Gygi SP. J Mass Spectrom. 2001;36:1083–1091. doi: 10.1002/jms.229. [DOI] [PubMed] [Google Scholar]
- 4.Beranova-Giorgianni S. Trends Anal Chem. 2003;22:273–281. [Google Scholar]
- 5.Conrads TP, Anderson GA, Veenstra TD, Pasa-Tolic L, Smith RD. Anal Chem. 2000;72:3349–3354. doi: 10.1021/ac0002386. [DOI] [PubMed] [Google Scholar]
- 6.Link AJ, Eng J, Schieltz DM, Carmack E, Mize GJ, Morris DR, Garvik BM, Yates JR., III Nat Am. 1999;17:676–682. doi: 10.1038/10890. [DOI] [PubMed] [Google Scholar]
- 7.Nepomuceno AI, Muddiman DC, Bergen R, Craighead JR, Burke MJ, Caskey PE, Allan JA. Anal Chem. 2003;75:3411–3418. doi: 10.1021/ac0342471. [DOI] [PubMed] [Google Scholar]
- 8.Wolters DA, Washburn MP, Yates JR., III Anal Chem. 2001;73:5683–5690. doi: 10.1021/ac010617e. [DOI] [PubMed] [Google Scholar]
- 9.McDonald H, Yates JR., III Disease Markers. 2002;18:99–105. doi: 10.1155/2002/505397. [DOI] [PMC free article] [PubMed] [Google Scholar]
- 10.Eng JK, McCormack AL, Yates JR., III J Am Soc Mass Spectrom. 1994;5:976–989. doi: 10.1016/1044-0305(94)80016-2. [DOI] [PubMed] [Google Scholar]
- 11.Smith RD, Anderson GA, Lipton MS, Pasa-Tolic L, Shen Y, Conrads TP, Veenstra TD, Udseth HR. Proteomics. 2002;2:513–523. doi: 10.1002/1615-9861(200205)2:5<513::AID-PROT513>3.0.CO;2-W. [DOI] [PubMed] [Google Scholar]
- 12.Lipton MS, Pasa-Tolic L, Anderson GA, Anderson DJ, Auberry DL, Battista JR, Daly MJ, Smith RD. Proc Natl Acad Sci USA. 2002;99:11049–11054. doi: 10.1073/pnas.172170199. [DOI] [PMC free article] [PubMed] [Google Scholar]
- 13.Beynon, J. H. Advances in Mass Spectrometry; Pergamnon Press: New York, 1963.
- 14.Kendrick E. Anal Chem. 1963;35:2146–2154. [Google Scholar]
- 15.Wu ZG, Rodgers RP, Marshall AG. Anal Chem. 2004;76:2511–2516. doi: 10.1021/ac0355449. [DOI] [PubMed] [Google Scholar]
- 16.Marshall AG, Rodgers RP. Acc Chem Res. 2004;37:53–59. doi: 10.1021/ar020177t. [DOI] [PubMed] [Google Scholar]
- 17.Stenson AC, Marshall AG, Cooper WT. Anal Chem. 2003;75:1275–1284. doi: 10.1021/ac026106p. [DOI] [PubMed] [Google Scholar]
- 18.Hughey CA, Hendrickson CL, Rodgers RP, Marshall AG, Qian KN. Anal Chem. 2001;73:4676–4681. doi: 10.1021/ac010560w. [DOI] [PubMed] [Google Scholar]
- 19.Jones JJ, Stump MJ, Fleming RC, Jackson O, Lay J, Wilkins CL. J Am Soc Mass Spectrom. 2004;15:1665–1674. doi: 10.1016/j.jasms.2004.08.007. [DOI] [PubMed] [Google Scholar]
- 20.Hall MP, Schneider LV. Expert Rev Proteomics. 2004;1:421–431. doi: 10.1586/14789450.1.4.421. [DOI] [PubMed] [Google Scholar]
- 21.Schneider, L. V.; Hall, M. P.; Petesch, R. Target Discovery: U. S.; 2002.
- 22.Wong RL, Amster IJ. J Am Soc Mass Spectrom. 2006;17:205–212. doi: 10.1016/j.jasms.2005.10.016. [DOI] [PMC free article] [PubMed] [Google Scholar]
- 23.Senko MW, Beu SC, McLafferty FW. J Am Soc Mass Spectrom. 1995;6:52–56. doi: 10.1016/1044-0305(94)00091-D. [DOI] [PubMed] [Google Scholar]
- 24.Goodlett DR, Bruce JE, Anderson GA, Rist B, Pasa-Tolic L, Fiehn O, Smith RD, Aebersold R. Anal Chem. 2000;72:1112–1118. doi: 10.1021/ac9913210. [DOI] [PubMed] [Google Scholar]
- 25.Oda Y, Cross FR, Cowbum D, Chait BT. Proc Natl Acad Sci USA. 1999;96:6591–6596. doi: 10.1073/pnas.96.12.6591. [DOI] [PMC free article] [PubMed] [Google Scholar]
- 26.Hendrickson EL, Kaul R, Zhou Y, Bovee D, Chapman P, Chung J, Conway de Macario E, Dodsworth JA, Gillett W, Graham DE, Hackett M, Haydock AK, Kang A, Land ML, Levy R, Lie TJ, Major TA, Moore BC, Porat I, Palmeiri A, Rouse G, Saenphimmachak C, Soll D, Van Dien S, Wang T, Whitman WB, Xia Q, Zhang Y, Larimer FW, Olson MV, Leigh JA. J Bacteriol. 2004;186:6956–6969. doi: 10.1128/JB.186.20.6956-6969.2004. [DOI] [PMC free article] [PubMed] [Google Scholar]
- 27.Medzihradszky KF, Leffler H, Baldwin MA, Burlingame AL. J Am Soc Mass Spectrom. 2001;12:215–221. doi: 10.1016/S1044-0305(00)00214-2. [DOI] [PubMed] [Google Scholar]
- 28.Bodnar WM, Blackburn RK, Krise JM, Moseley MA. J Am Soc Mass Spectrom. 2003;14:971–979. doi: 10.1016/S1044-0305(03)00209-5. [DOI] [PubMed] [Google Scholar]
- 29.Stapels MD, Barofsky DF. Anal Chem. 2004;76:5423–5430. doi: 10.1021/ac030427z. [DOI] [PubMed] [Google Scholar]
- 30.Gygi SP, Rist B, Griffin TJ, Eng J, Aebersold R. J Proteome Res. 2002;1:47–54. doi: 10.1021/pr015509n. [DOI] [PubMed] [Google Scholar]
- 31.Hernandez, H.; Li, C.; Niehauser, S.; Gawandi, V.; Phillips, R. S.; Amster, I. J. San Antonio, TX, June 5–9 2005.
Associated Data
This section collects any data citations, data availability statements, or supplementary materials included in this article.


