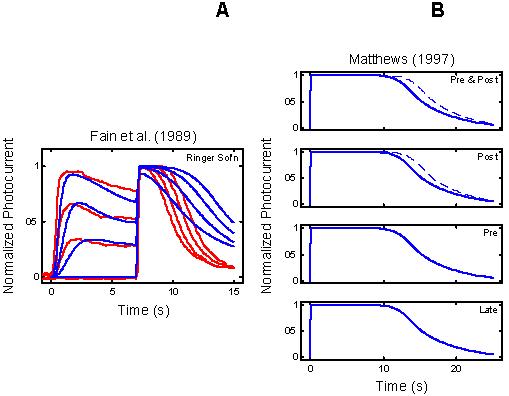
Figure 5.

With τE rate-limiting, the RecRK model accounts for the qualitative features of the Fain et al. [27] step-flash data and the Matthews [3] Ca++ clamp data. With the same parameters as in Figure 3 and Figure 4, the RecRK model with τE rate-limiting also reproduces the signature features of the Fain et al. [27] data; the model saturated flash response emerges out of saturation faster as the intensity of a conditioning step is increased (Figure 5A). Under simulated Ca++ clamp, the model reproduces the qualitative behavior of the Matthews [3] data (Figure 5B); the period of saturation (blue solid curve) is prolonged (blue dashed curve) by the application of the Ca++ clamp near the time of the flash (“Pre & Post”, “Post”), but not if the flash occurs too early (“Pre”) or too late (“Late”). Compare with Figure 2.
