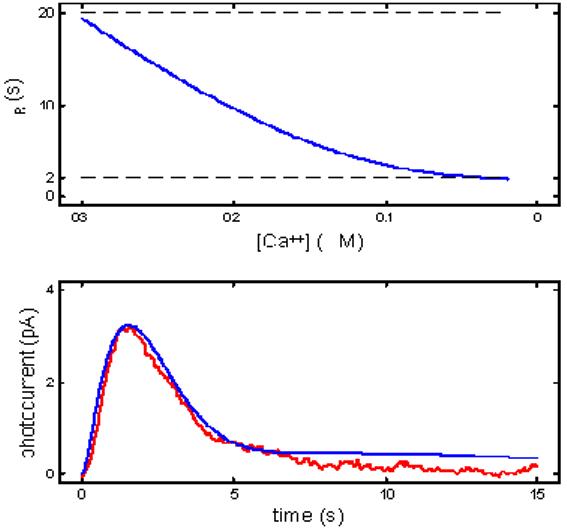
Figure 7.

Consequences for the dim-flash response when τR is rate-limiting in a RecRK model. Within the context of a RecRK model structure, rate-limitation by R* lifetime is incommensurate with the kinetics of the dim-flash response. Top panel: The relationship between τR and the level of Ca++ as it falls from a dark value of 0.3 μM to a minimum of 0.02 μM. In this example, parameters in the RecRK model were set such that as Ca++ fell from its dark value to its theoretical physiological minimum, the model τR decreased from 20 s to 2 s. Bottom panel: Resulting dim-flash response from model in top panel (blue curve) in comparison to an empirical dim-flash response (red; curve 2 from Rieke & Baylor [16]; see Figure 1A). The model response was the result of optimizing the RecRK model to the Murnick & Lamb data and to the sub-saturating flash responses with the RecRK parameters set to generate the profile in the top panel. Clearly, with τR being Ca++-sensitive, and the requirement that the change in τR effect a large (10x) gain change, and that, at its minimum, τR remain rate-limiting with a time constant of ∼2 s, the model dim-flash response recovers much too slowly in comparison with empirical rod responses.
