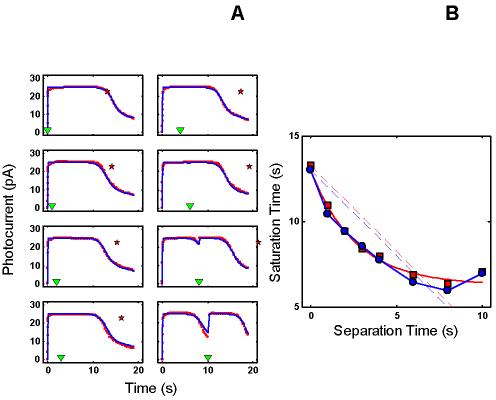
Figure 9.

An R* activation model with τE rate-limiting accounts for the Murnick & Lamb data. A : With τE rate-limiting, the R* activation model provides a good fit to the Murnick & Lamb saturated two-flash data. B : The corresponding model Testflash Tsat versus delay along with the Murnick & Lamb data. As was seen in comparable results from the RecRK model (Figure 3B), the model is able to capture the critical feature of the data, i.e., that the decrease model Test flash Tsat in response to the Pre-flash can exceed the delay (blue curve falls below dashed blue line with slope = −1). The format and symbology for this figure is the same as for Figure 3. Parameters for this model are given in Table 3.
