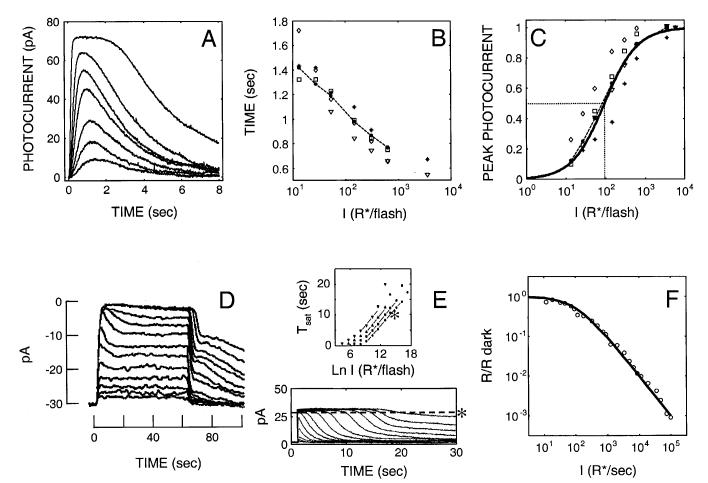
Fig. 1.
Empirical S/R suite of rod responses. (A) Ref flash responses from larval tiger salamander rods (whole-cell, voltage-clamped recordings in the perforated patch mode; data provided by J.I. Korenbrot, UCSF). Stimuli were 20-ms flashes at 520 nm: 13, 27, 54, 148, 310, 620 to 3541 R*/flash. (B) Time-to-peak (Tpk) versus log (R*/flash). Tpk for the Ref flash responses are shown as filled circles with solid lines, along with Tpk data from four other cells recorded under the same conditions. The Tpk of the Ref data decreases by ∼380 ms/log unit from 1400 ms to 760 ms, over the 3-log-unit range of I. All five rods undergo comparable changes in Tpk with intensity (C) Peak response amplitude (Rpk) vs log (R*) for the same 5 rods (Ref data, filled circles). Note that the I1/2 of the Ref rod (95 R*/flash) is representative of the 5 rods shown, and is close to the values reported in Miller and Korenbrot (1994) and Korenbrot (1995). (D) Step responses from newt rods (Forti et al., 1989; Torre et al., 1990).*,† Note the “nose” at step onset that recovers to a steady-state (LA) level, and a multiphasic response at step offset exhibiting a fast recovery phase followed by a slow phase, with some damped resonant behavior in between. (E) Highly saturated, DA responses to 100-ms flashes along with corresponding Tsat functions taken at four recovery criteria (lowest Tsat function corresponds to a 10% recovery criterion, as indicated by the horizontal dashed line through the photocurrent data). Data are from Pepperberg et al. (1992). Flashes ranged from 8 R*/flash to more than 2.9 ×10⁷ R*/flash (>6.5 log10 units). Note that the Tsat functions have a slope of ∼2 s/ln unit, and that the Tsat data accelerate at the highest intensities. (F) LA flash sensitivity versus log (Ib). Flash sensitivity is defined as the peak amplitude of a flash response in the presence of a background, divided by the DA peak flash response amplitude (R/RDA). The data are from six newt rods studied by Torre et al. (1990). Note the data obey the Weber-Fechner relation over ∼4 log units of Ib, and have an I1/2 of 100 R*/s.

