
Figure 3.
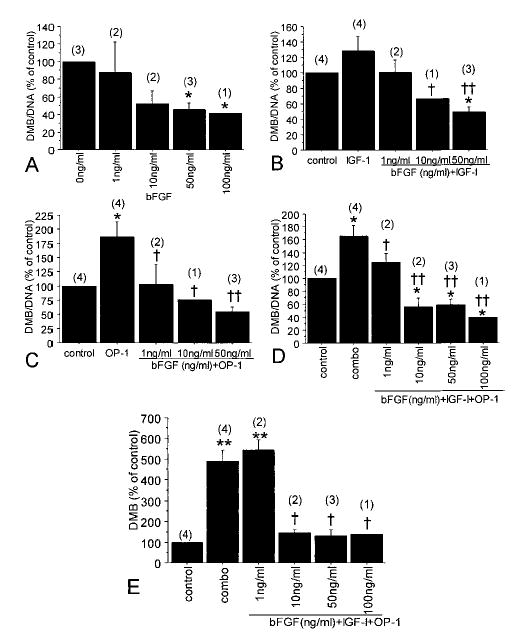
Chondrocyte proteoglycan production after culture in the presence of bFGF, IGF-1, and OP-1. Human articular chondrocytes were cultured in alginate in serum-free medium with mini-ITS+ (control) or the control medium plus bFGF (0–100 ng/ml), IGF-1 (100 ng/ml), and/or OP-1 (100 ng/ml). The amount of proteoglycan in the alginate beads (cell-associated and further-removed matrix) was measured by the dimethylmethylene blue (DMMB) assay and normalized to cell numbers using DNA measurements (DMMB/DNA). Samples were measured in triplicate and are expressed as a percentage of the day 21 control cultures (mean and SEM). Numbers in parentheses are the number of donors used for each culture condition. Results are for cultures with A, bFGF alone (* = P < 0.05 versus control); B, bFGF plus IGF-1 (* = P = 0.02 versus control; † = P = 0.04 versus IGF-1; †† = P = 0.002 versus IGF-1); C, bFGF plus OP-1 (* = P < 0.008 versus control; † = P = 0.02 versus OP-1; †† = P = 0.001 versus OP-1); and D, bFGF plus IGF-1 and OP-1 (“combo”) (* = P < 0.05 versus control; † = P < 0.05 versus combo; †† = P < 0.001 versus combo). E, Results of the same experiments shown in D, but for the total DMMB in the beads, without DNA correction (** = P < 0.0001 versus control; † = P < 0.001 versus combo). See Figure 1 for other definitions.