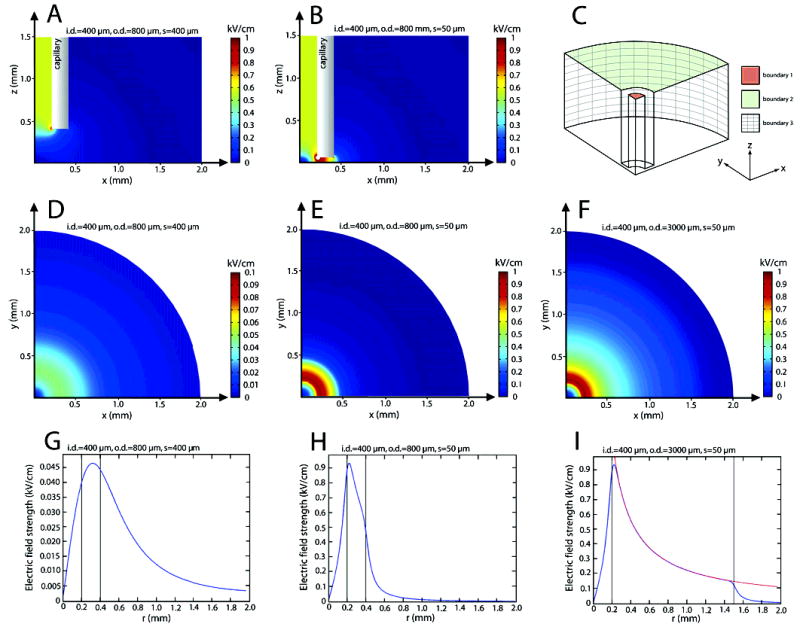
Figure 2.

FEM simulations of the distribution of electric field under the rim of the capillary electrode. (A) and (B) show cross sections of a capillary electrode (i.d. = 400 μm, o.d. = 800 μm) kept 400 (A) and 50 μm (B) above a nonconducting surface. In (C), the geometry used for a FEM simulation of the electric field is shown. To make the simulations less memory demanding, symmetry was utilized and only one-quarter of the lower end of the capillary and its surrounding simulated. (D)-(F) show the electric field 3 μm above the bottom surface (z = 3 μm) for the following capillary electrodes: (D) i.d. = 400 μm, o.d. = 800 μm, and slit height s = 400 μm; (E) i.d. = 400 μm, o.d. = 800 μm, and slit height s = 50 μm; (F) i.d. = 400 μm, o.d. = 3000 μm, and slit height s = 50 μm. Note that the scale in (D) is different from the scales in (E) and (F). (G–I) Plots of how the electric field strength varies with r (r = (x2 + y2)1/2) for three different capillary electrodes: (G) i.d. = 400 μm, o.d. = 800 μm, and slit height s = 400 μm; (H) i.d. = 400 μm, o.d. = 800 μm, slit height s = 50 μm; (I) i.d. = 400 μm, o.d. = 3000 μm, slit height s = 50 μm. Note that (G) has a different scale than (H) and (I). The black lines mark the inner and outer diameters of the capillary electrodes. As can be seen, the field declines fast outside a capillary electrode when its rim is held close to the bottom surface. Note the similarity in the field distribution for r < 400 μm in (H) and (I). Assuming no current flow in the z direction under the rim of a capillary, the total current passing at any height above the surface is constant for all radii. Thus, |E|·r = K, where K is a constant that can be decided by any valid combination of E and r. This also implies that the electric field should decrease proportional to K/r as r is increased. By readout from (I), K could be decided to 0.91 for the used settings. The red line in (I) is the curve |E| = 0.91/r, and as can be seen, it follows the simulated field profile almost perfect under the rim of the capillary.
