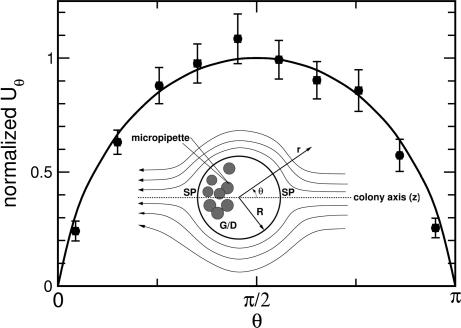
Fig. 3.
Fluid flow near the surface of a colony. Inset shows geometry of the experiment. The organism is held fixed by using a micropipette attached to the posterior region, in the vicinity of the germ cells/daughter colonies (G/D), away from the two stagnation points (SP) of the flow. The fluid flow generated by the colony is measured by using particle imaging velocimetry. Comparison between theoretical (solid curve) and average experimental values (solid circles) of the tangential flow velocity near the organism’s surface is plotted as a function of polar angle θ. Measurements were made on 10 different organisms. For each, a least-squares fit to the theoretical velocity field was performed to determine the single unknown parameter, the maximum tangential velocity. These data then were pooled by normalizing each set to the fitted maximum velocity, ranging from 100 to 600 μm/s for the variously sized colonies measured.

