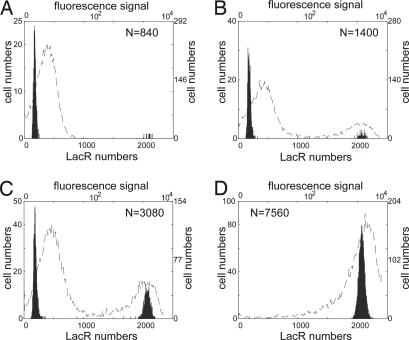
Fig. 6.
Comparison of simulation results with experimental observations for the genetic toggle switch interfaced by the quorum-sensing signaling pathway. Numbers of cells with different molecular numbers of LacR are based on simulations with different cell population densities in the culture, and experimental observations in fluorescence signal are derived from figure 6B in ref. 11 using the top and right labels. (A) n = 840; only nine cells have high LacR expression levels, and A600 = 0.06. (B) n = 1,400; 68 cells have high LacR expression levels, and A600 = 0.10. (C) n = 3,080; 1,042 cells have high LacR expression levels, and A600 = 0.22. (D) n = 7,560; all cells have high LacR expression levels, and A600 = 0.54.

