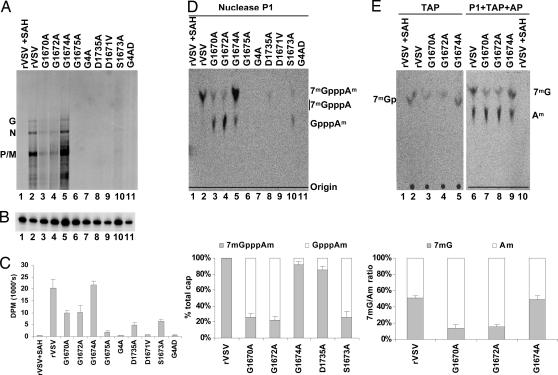
Fig. 3.
Effect of L gene mutations on 2′-O and G-N-7 methylation. (A) RNA was synthesized in the presence of [3H]AdoMet and analyzed by electrophoresis on acid-agarose gels. The virus and the identity of the mRNAs are shown. (B) RNA from A was examined by primer extension assay by using a primer designed to anneal to the N mRNA. (C) [3H]AdoMet incorporation monitored by scintillation counting. Three independent experiments were used to generate the graph shown. (D and E) (Upper) RNA was digested with P1, TAP, and AP, and the products were analyzed by TLC on PEI cellulose F sheets. Plates were dried, and the spots were visualized with a phosphoimager. The identity of the virus and the migration of the markers 7mGpppA, GpppA, 7mG, and 2′-OmA are shown. (Lower) Quantitative analysis of three independent experiments is shown. For each virus, the fraction of the mRNA cap that was 7mGpppAm and GpppAm or 7mG and 2′-OmA is shown (mean ± SD).

