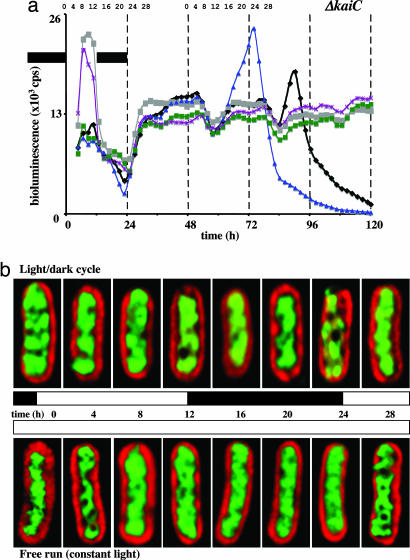
Fig. 3.
Gene expression and chromosome compaction in an S. elongatus kaiC strain. (a) As in Fig. 1a but with a kaiC-null strain. Five independent data sets are graphed. (b) As in Fig. 1b but with a kaiC-null strain. The chromosome arrangement shown for each time point is representative of >90% (n = 300) of the cells from that sample. Each time course experiment was repeated six times. For any given time point within each experiment, some variation in the extent of chromosome compaction was evident in this mutant strain. This variation was also reflected in the gene expression rhythms illustrated in a. However, we never saw rhythmic compaction patterns (n = 6). Note the partial compaction at several time points in each time course panel. Evidently, KaiC protein is not directly responsible for the entire chromosome compaction process. Cells are 4–5 μm long.

