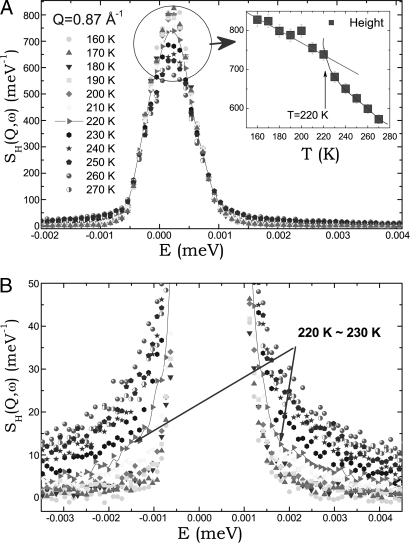
Fig. 1.
Measured neutron spectra. Shown are normalized QENS spectra at Q = 0.87 Å−1, displaying the height of the peak (A) and the wing of the peak (B) at a series of temperatures. (A Inset) A plot of the peak heights vs. temperature. Arrows in B highlight the wing of the spectra at the crossover temperature.

