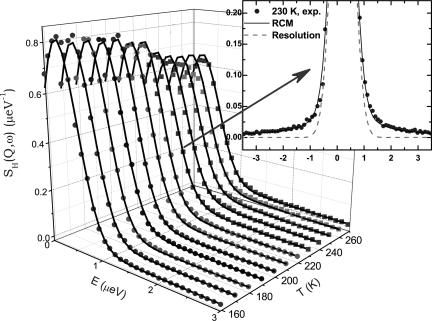
Fig. 2.
Neutron spectra and their RCM analyses. Measured QENS spectra (filled symbols) and their RCM analysis results (solid lines) at Q = 0.87 Å−1 and at a series of temperatures are shown. (Inset) One particular spectrum at T = 230 K is singled out and contrasted with the resolution function of the instrument for this Q value (dashed line).

