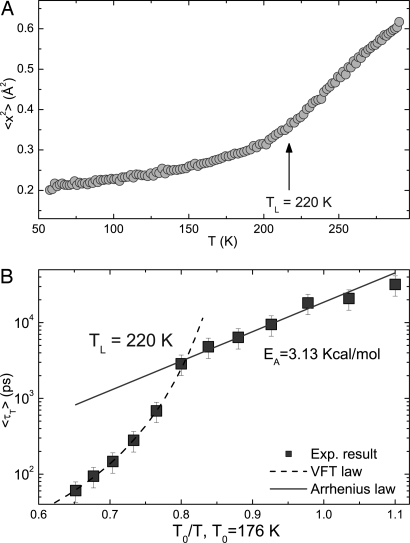
Fig. 3.
Evidence for the dynamic transition. (A) The temperature dependence of the mean-squared atomic displacement of the hydrogen atom at 2-ns time scale measured by an elastic scan with resolution of 0.8 μeV. (B) Temperature dependence of the average translational relaxation times plotted in log(〈τT〉) vs. T0/T, where T0 is the ideal glass transition temperature. Here, there is a clear and abrupt transition from a Vogel–Fulcher–Tammann law at high temperatures to an Arrhenius law at low temperatures, with the fitted crossover temperature TL = 220 K and the activation energy EA = 3.13 kcal/mol extracted from the Arrhenius part indicated in the figure.

