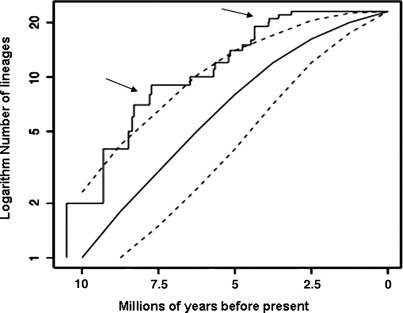
Fig. 2.
A lineage through time plot of the logarithm number of species against millions of years before present generated from the phylogeny based on trnL+trnL−trnF for Agave sensu lato. The dashed lines represent the 95% confidence interval of the expected number of lineages present over time when 26 individuals are sampled from a total phylogeny of 208 individuals. Arrows point to the time intervals when the observed number of lineages is greater than expected under a pure birth–death model of diversification.

