Figure 2.
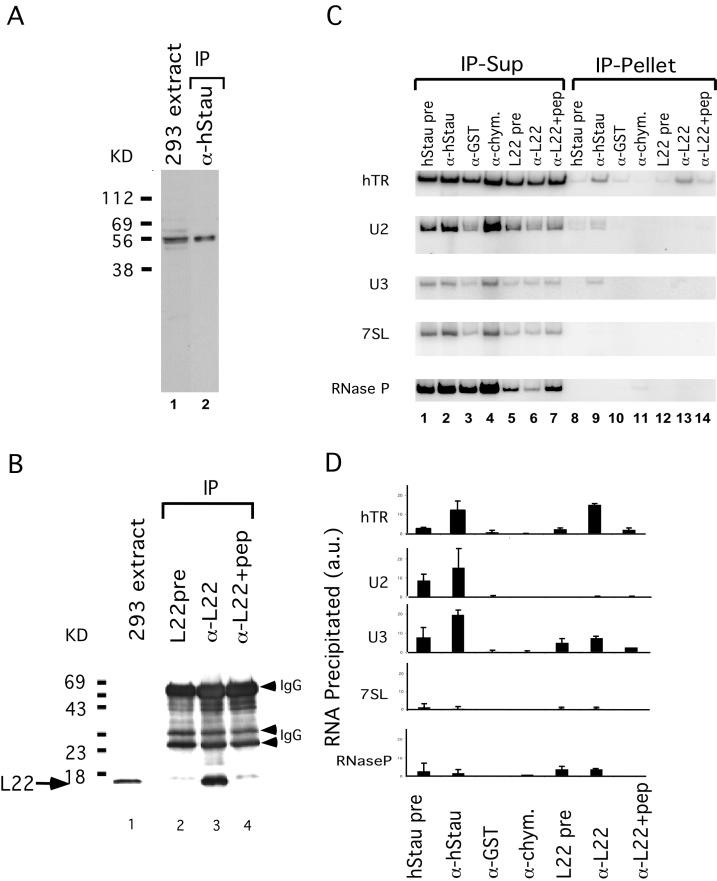
hStau and L22 interact with hTR. (A) hStau antibody specificity. Western blot analysis on a 293 cell extract (lane 1) and hStau immunoprecipitates (lane 2) using anti-hStau antibody shows the 55-kDa hStau protein. The relative mobility of molecular weight markers (in kilodaltons) is indicated on the left. (B) L22 antibody specificity. Western blot analysis on 293 cell extracts (lane 1) and L22 immunoprecipitates (lanes 2–4) is shown. Lane 2, precipitation using preimmune serum (pre); lane 3, precipitation using anti-L22 serum; and lane 4, preincubation of L22 peptide (pep) with anti-L22 serum before immunoprecipitation. The relative mobility of molecular weight markers (in kilodaltons) is indicated on the left. The arrow indicates the L22 band (15 kDa). The IgG heavy and light chains (arrowheads) are also indicated. (C) RT-PCR analysis of RNAs in the supernatant (Sup; lanes 1–7) and pellet (lanes 8–14) fractions of hStau and L22 immunoprecipitation reactions. Lanes 1 and 8, hStau precipitation using preimmune serum; lanes 2 and 9, precipitation using anti-hStau antibody; lanes 3 and 10, precipitation using anti-GST antibody; lanes 4 and 11, precipitation using anti-chymotrypsin (-chym.) antibody; lanes 5 and 12, precipitation using L22 preimmune serum; lanes 6 and 13, precipitation using anti-L22 antibody; and lanes 7 and 14, precipitation using anti-L22 antibody preincubated with L22 peptide. The RNAs amplified in the fractions are indicated on the left (hTR, U2, U3, 7SL, and RNase P). (D) Quantitation of RNAs precipitated in C. The RNA precipitated is expressed as a fraction of the total signal intensity obtained in both the pellet and supernatant. RNAs assayed are indicated on the left, and antibodies used are indicated on the bottom. L22+pep, L22 antibodies preincubated with the L22 peptide before immunoprecipitation. a.u., arbitrary units.

