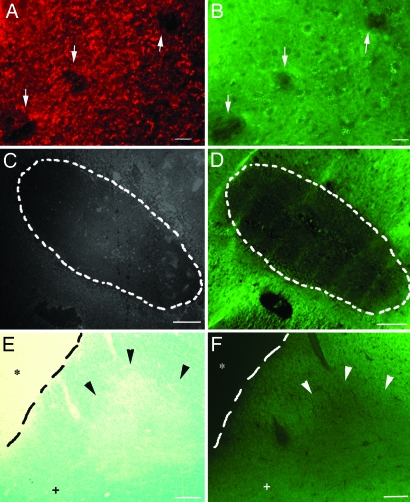
Fig. 5.
Visualization of EAE and MS demyelinated lesions by using BMB. (A and B) When BMB (40 mg/kg) was injected i.p. into mice at day 21 after induction of EAE, all demyelinated lesions identified with PLP immunostaining (arrows, A) were also visualized on adjacent sections with BMB (arrows, B). (C and D) On postmortem adjacent sections of human MS brain, demyelinated PLP-negative plaques (dashed line, C) were also identified after ex vivo incubation of 1 mM BMB (dashed line, D). (E and F) In remyelinated shadow plaques (arrowheads), BMB staining showed intermediate intensity between demyelinated plaques (∗) and normal-appearing white matter (+) [luxol staining (E); BMB staining (F); demyelinated lesion is delineated by the dashed line]. All lines were drawn by hand. (Scale bars: A and B, 30 μm; C and D, 500 μm; E and F, 150 μm.)

