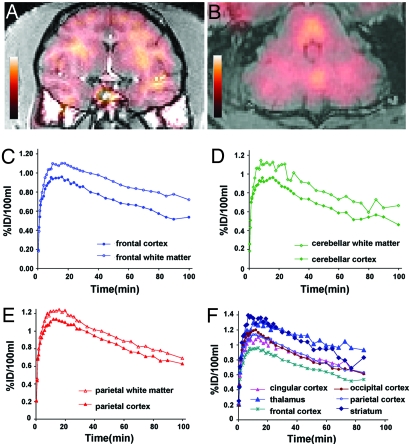
Fig. 7.
CNS PET imaging using [11C]BMB. [11C]BMB was injected i.v. (99 MBq) to an anesthetized baboon, and a 110-min PET examination was performed by using an ECAT HR+ camera (Siemens Medical Solution, Knoxville, TN). (A and B) The frontal coronal slice (A) and the cerebellar axial slice (B) from the PET examination were superimposed onto the corresponding slices of the brain MRI scan. PET images shown correspond to the activity between 80 and 110 min. (Magnification: A, ×0.11; B, ×0.15.) (C–E) Comparison of the radioactivity (expressed in percent of injected dose per 100 ml of brain tissue) obtained in subcortical white matter and adjacent cortical area, in frontal (C), cerebellar (D), and parietal (E) regions. Note that fixation of the tracer in white matter became higher than in the adjacent cortex after 10–20 min. (F) Comparison of the radioactivity in several regions of gray matter.

